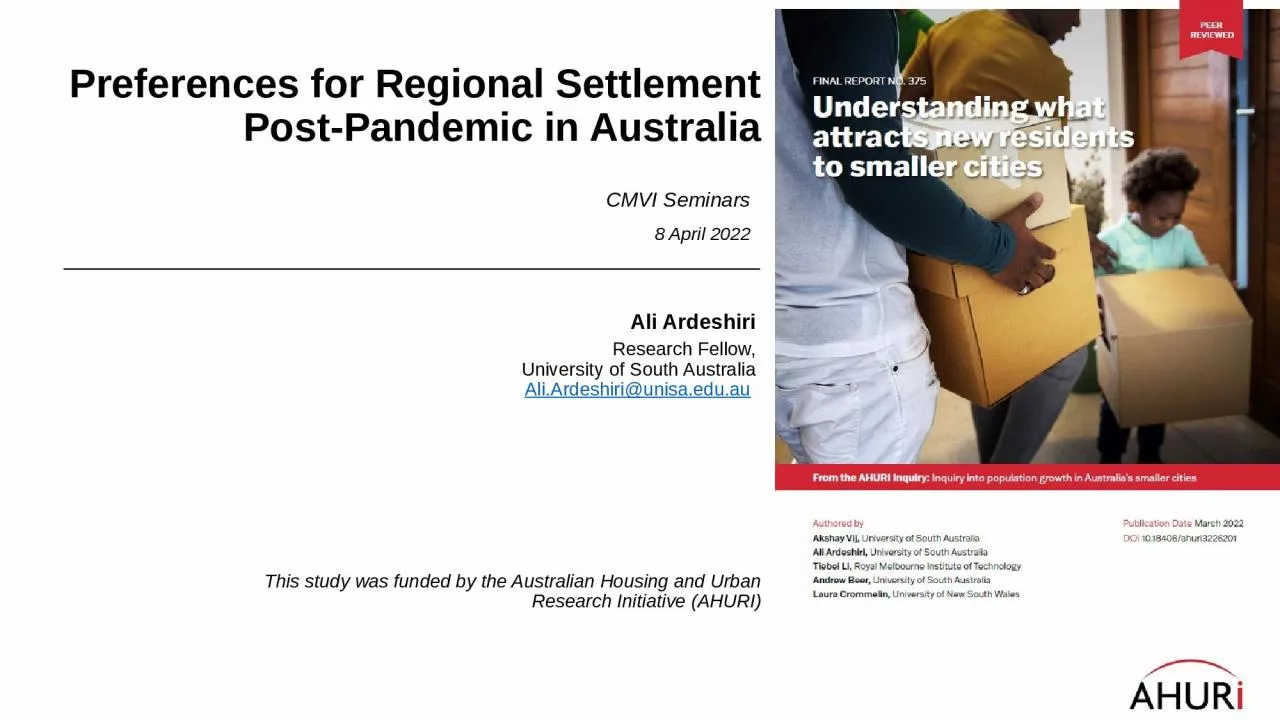
/
Preferences for Regional Settlement Post-Pandemic in Australia Preferences for Regional Settlement Post-Pandemic in Australia

Preferences for Regional Settlement Post-Pandemic in Australia - PowerPoint Presentation

white
white . @white
Follow
64 views
Uploaded On 2024-01-29

Preferences for Regional Settlement Post-Pandemic in Australia - PPT Presentation

CMVI Seminars 8 April 2022 This study was funded by the Australian Housing and Urban Research Initiative AHURI Ali Ardeshiri Research Fellow University of South Australia AliArdeshiriunisaeduau ID: 1042653

large cities sized mid cities large mid sized city living individuals smaller move migration regional lived time income class

Share:

Link:

Embed:

Download Presentation from below link

Download Presentation The PPT/PDF document "Preferences for Regional Settlement Post..." is the property of its rightful owner. Permission is granted to download and print the materials on this web site for personal, non-commercial use only, and to display it on your personal computer provided you do not modify the materials and that you retain all copyright notices contained in the materials. By downloading content from our website, you accept the terms of this agreement.


Presentation Transcript

1. Preferences for Regional Settlement Post-Pandemic in AustraliaCMVI Seminars8 April 2022This study was funded by the Australian Housing and Urban Research Initiative (AHURI)Ali ArdeshiriResearch Fellow,University of South AustraliaAli.Ardeshiri@unisa.edu.au

2. Source: https://www.sbs.com.au/language/english/living-in-regional-australiaSource: https://7news.com.au/news/immigration/sydney-melbourne-exodus-not-over-yet-c-4819385

3. Source: https://www.muval.com.au/blog/moving-trends-australia

4. Source: https://population.gov.au/docs/the-impacts-of-covid-on-migration-between-cities-and-regions.pdf“Our central projection scenario sees a net shift in migration away from capital cities in favour of regional areas in 2020-21, before gradually returning towards the long-run average.“Underscoring the uncertainty surrounding this topic, surveyed experts were split on the impact of COVID-19. Approximately half expect it to have no impact on migration patterns between cities and regions, with the other half expecting a slight shift in favour of migration from capital cities to regional areas.” 4

5. Research objectivesExamine key drivers of migration flows and settlement patterns across Australia; and Identify key barriers to and opportunities for greater population decentralisation.5

6. DataNationwide online survey of 3,012 demographically and geographically representative Australians administered in February 2021.6

7. Descriptive analysisRespondents key demographics based on their current city of residence size

8. Migration patterns as a function of current city of residence 8Descriptive analysis

9. Descriptive analysis Total sampleLived in large citiesLived in mid-sized citiesMean18.9 years20.9 years12.90 yearsMedian13 years16 years8 yearsRespondents length of stay in each Australian city

10. Reason for moveFull sampleCurrently living in a mid-sized city (16.6%)Currently living in a large city (83.4%)Always lived in mid-sized citiesMigrated from large to mid-sized citiesMigrated from mid-sized cities to large cities and returned back to mid-sized citiesMoving between large and mid-sized cities (currently living in a mid-sized city)Always lived in a large cityMigrated from mid-sized cities to large citiesMigrated from large cities to mid-sized cities and returened to a large cityMoving between large and mid-cities and currently living in a large cityReason for move to large cityReason for return to mid-sized cityReason for move to mid-sized cityReason for return to large cityEmployment and industry related issues27.3%22.4%23.2%31.3%31.3%38.0%17.3%29.1%42.7%29.3%37.6%Being close to family21.2%32.5%23.2%8.3%18.8%21.5%31.1%18.8%16.0%17.3%14.0%Place of birth10.9%8.4%20.4%10.4%6.3%6.3%15.0%21.8%5.3%22.7%6.5%Better quality of life8.9%10.3%7.2%4.2%8.3%8.3%11.2%1.1%4.0%8.0%4.8%Education8.0%5.2%8.3%18.8%10.4%3.9%6.7%13.8%9.3%8.0%5.4%More affordable housing5.1%5.7%7.2%8.3%2.1%5.9%3.2%2.3%5.3%2.7%2.7%Attractive environment3.7%3.2%2.8%2.1%4.2%2.9%3.0%1.5%2.7%2.7%7.0%Higher income2.1%1.5%0.6%2.1%2.1%0.0%1.6%1.9%1.3%1.3%2.7%Better prospects to raise children(s)1.6%1.5%0.6%4.2%2.1%1.5%1.8%1.1%1.3%0.0%1.1%Better services (e.g. healthcare, banking, retail, etc.)1.3%1.2%0.6%0.0%0.0%0.5%1.7%0.4%2.7%1.3%2.7%Health related reasons1.2%0.0%0.6%0.0%2.1%0.0%0.6%0.8%1.3%0.0%2.7%Live in community with similar backgrounds1.0%1.5%1.1%0.0%0.0%1.5%0.5%0.0%0.0%1.3%1.6%Greater sense of community and belonging1.0%1.2%0.0%0.0%2.1%1.0%1.1%0.8%0.0%0.0%2.2%Amenities and entertainment facilities0.8%0.2%0.6%0.0%0.0%1.5%0.8%0.8%0.0%0.0%2.7%Reasons for settlement in different cities, as a function of migration histories 10

11. The important city characteristics when deciding a city to liveDescriptive analysis

12. Reasons for not wanting to leave the present city of residenceDescriptive analysis

13. The characteristic which describes a mid-sized and large cityDescriptive analysis

14. The characteristic which describes a mid-sized and large cityDescriptive analysis

15. The characteristic which describes a mid-sized and large cityDescriptive analysis

16. Descriptive analysis

17. Example scenario from the stated preference experiment 17

18. #AttributeRange of values1Distance to coaston the coast; 37.5 km, 75km, 200km, 600km2Population size: mid-sized cities5k; 10k; 25k; 50k; 75k; 100kPopulation size: large cities250k; 500k; 750k; 1m; 1.5m; 2m; 2.5m; 5m3Average annual income per person$55k, $60k, $65k, $70k, $75k, $85k, $90k, $100k4Unemployment rate3%, 5%, 7%, 9%, 11%, 13%, 15%5Urban centre classificationindustry city; service city; connected city; coastal lifestyle city; mixed function centre; agricultural city6Average home sales value $240k, $400k, $560k, $650k, $720k, $880k, $1.04m, $1.2m7Average daily commute time (minutes)20, 30, 40, 50, 60, 70, 80, 908Average monthly cost of living for single person (excluding rent)$1k; $1.1k; $1.2k; $1.3k; $1.4k; $1.5k9Climate classificationhot humid summer, warm winter; warm humid summer, mild winter; hot dry summer, warm winter;hot dry summer, cool winter;warm temperate;mild temperate;cool temperate;alpineRange of attribute values used in our SP experiments to describe each urban area across different scenarios 18

19.  Class 1Metropolitan enthusiastsClass 2 Class 3 Class 4Regional enthusiastsShare of sample population16 per cent21 per cent54 per cent9 per centPreferences for city sizePrefer larger citiesPreference for smaller cities, ceteris paribusNeutralVery strong preference for smaller citiesSensitivity to other city characteristicsCare about wages, distance to coast, and access to urban amenities, insensitive to other attributesCare about unemployment rates, insensitive to other attributesIn descending order of importance, sensitive to wages, living costs, housing costs, commute times, unemployment, and distance to coastInsensitive to any other city characteristicsSettlement and migration historyHighly likely to have always lived in large cities, and reluctant to leave large citiesHighly likely to be currently living in large cities, but have lived in mid-sized cities in the past, and open to moving to one againProportionally split between large and mid-sized city residentsMost likely to be currently living in a mid-sized city, or have lived in one in the pastAttitudes towards large and mid-sized cities-Do not view large cities as good places to live, would move to smaller cities if offered support for home ownershipView mid-sized cities as good places to retire, would move to smaller cities if offered support for post-retirement living-Demographic characteristicsMore likely to be younger, higher-income professionals that are single or part of a couple, and with no childrenMore likely to be a mix of young individuals living in single or shared households, and middle-aged individuals living in households with children. Tend to be university-educated and employed full-time in high-wage managerial or professional jobs in white-collar sectors.More likely to be older, lower-income individuals without a college degree that are employed part-time or retiredMore likely to be older, lower-income individuals without a college degree that are employed part-time or retiredNarrative summary of different segments in the sample population 19

20.  Class 1Metropolitan enthusiastsClass 2 Class 3 Class 4Regional enthusiastsShare of sample population16 per cent21 per cent54 per cent9 per centPreferences for city sizePrefer larger citiesPreference for smaller cities, ceteris paribusNeutralVery strong preference for smaller citiesSensitivity to other city characteristicsCare about wages, distance to coast, and access to urban amenities, insensitive to other attributesCare about unemployment rates, insensitive to other attributesIn descending order of importance, sensitive to wages, living costs, housing costs, commute times, unemployment, and distance to coastInsensitive to any other city characteristicsSettlement and migration historyHighly likely to have always lived in large cities, and reluctant to leave large citiesHighly likely to be currently living in large cities, but have lived in mid-sized cities in the past, and open to moving to one againProportionally split between large and mid-sized city residentsMost likely to be currently living in a mid-sized city, or have lived in one in the pastAttitudes towards large and mid-sized cities-Do not view large cities as good places to live, would move to smaller cities if offered support for home ownershipView mid-sized cities as good places to retire, would move to smaller cities if offered support for post-retirement living-Demographic characteristicsMore likely to be younger, higher-income professionals that are single or part of a couple, and with no childrenMore likely to be a mix of young individuals living in single or shared households, and middle-aged individuals living in households with children. Tend to be university-educated and employed full-time in high-wage managerial or professional jobs in white-collar sectors.More likely to be older, lower-income individuals without a college degree that are employed part-time or retiredMore likely to be older, lower-income individuals without a college degree that are employed part-time or retiredNarrative summary of different segments in the sample population 20

21.  Class 1Metropolitan enthusiastsClass 2 Class 3 Class 4Regional enthusiastsShare of sample population16 per cent21 per cent54 per cent9 per centPreferences for city sizePrefer larger citiesPreference for smaller cities, ceteris paribusNeutralVery strong preference for smaller citiesSensitivity to other city characteristicsCare about wages, distance to coast, and access to urban amenities, insensitive to other attributesCare about unemployment rates, insensitive to other attributesIn descending order of importance, sensitive to wages, living costs, housing costs, commute times, unemployment, and distance to coastInsensitive to any other city characteristicsSettlement and migration historyHighly likely to have always lived in large cities, and reluctant to leave large citiesHighly likely to be currently living in large cities, but have lived in mid-sized cities in the past, and open to moving to one againProportionally split between large and mid-sized city residentsMost likely to be currently living in a mid-sized city, or have lived in one in the pastAttitudes towards large and mid-sized cities-Do not view large cities as good places to live, would move to smaller cities if offered support for home ownershipView mid-sized cities as good places to retire, would move to smaller cities if offered support for post-retirement living-Demographic characteristicsMore likely to be younger, higher-income professionals that are single or part of a couple, and with no childrenMore likely to be a mix of young individuals living in single or shared households, and middle-aged individuals living in households with children. Tend to be university-educated and employed full-time in high-wage managerial or professional jobs in white-collar sectors.More likely to be older, lower-income individuals without a college degree that are employed part-time or retiredMore likely to be older, lower-income individuals without a college degree that are employed part-time or retiredNarrative summary of different segments in the sample population 21

22. Develop local employment opportunities in regional centres: One-in-five Australians is open to moving to a mid-sized city if it could offer comparable employment and education opportunities to large cities Develop higher education institutions in regional centres: On average, mid-sized urban areas have had net out-migration rates of 30 per cent for young adults over the period 2011-16, and our analysis finds that these individuals place the greatest importance on employment and education opportunities Develop digital infrastructure in regional centres to support remote working and long-distance learning: Widespread adoption of remote working and long-distance learning arrangements during the COVID-19 pandemic could make employment and education opportunities available in regional centres Develop physical infrastructure for post-retirement living in regional centres: One-in-two Australians view mid-sized cities as excellent places to retire, and would be encouraged to move there if they could get support for post retirement living in terms of healthcare, home ownership and access to other amenities.Policy development options22

23. Future work extensionResearch objectiveExamine the primary determinants of firm and residential location patterns across Australia;Identify key drivers of or barriers to attracting and retaining businesses and households to regional cities;Analyse possible long-term impacts of COVID-19 on firm and residential location decisions across metropolitan and regional cities; and Predict resulting spatial patterns of employment activity and residential settlement within and across these cities under different future scenarios.

24. Sub-populationScenarioPotential responseCurrent job offers ability to work remotelyCurrent employer offers you the ability to work remotely 2-3 days a weekMost likely to move within current city of residence, but no change in employmentCurrent employer offers you the ability to work remotely full-timeCould move within current city or to a different city, but no change in employmentNew employer offers new job in similar role with some degree of flexibilityCould move within city, or to a different city, but would entail a change in employmentCurrent job does not offer ability to work remotelyNew employer offers new job that has some ability to be done remotelyPotential employment-focused SP scenarios and potential responses across different sub-populationsFuture work extension

25. Future work extension