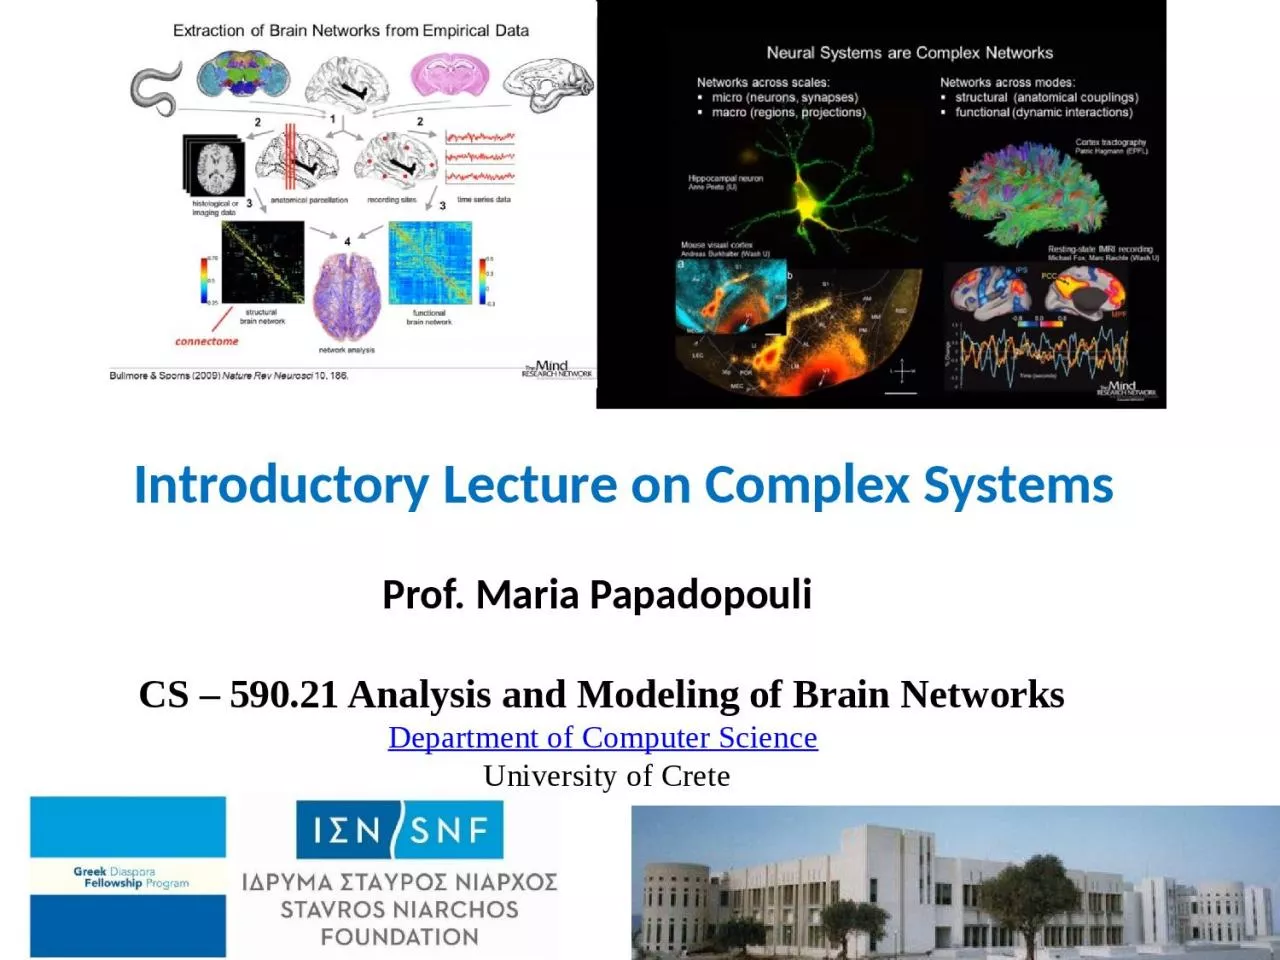
/
CS – 590.21 Analysis and Modeling of Brain Networks  CS – 590.21 Analysis and Modeling of Brain Networks 

CS – 590.21 Analysis and Modeling of Brain Networks  - PowerPoint Presentation

willow
willow . @willow
Follow
0 views
Uploaded On 2024-03-13

CS – 590.21 Analysis and Modeling of Brain Networks  - PPT Presentation

Department of Computer Science   University of Crete Introductory Lecture on Complex Systems Prof Maria Papadopouli Each column contains three examples of systems consisting of the same components from left to right molecules cells p ID: 1047787

system amp systems complexity amp system complexity systems entropy behavior excess high completely information components level neural complex structure

Share:

Link:

Embed:

Download Presentation from below link

Download Presentation The PPT/PDF document "CS – 590.21 Analysis and Modeling of B..." is the property of its rightful owner. Permission is granted to download and print the materials on this web site for personal, non-commercial use only, and to display it on your personal computer provided you do not modify the materials and that you retain all copyright notices contained in the materials. By downloading content from our website, you accept the terms of this agreement.


Presentation Transcript

1. CS – 590.21 Analysis and Modeling of Brain Networks Department of Computer Science University of CreteIntroductory Lecture on Complex Systems Prof. Maria Papadopouli

2. Each column contains three examples of systems consisting of the same components (from left to right: molecules, cells, people) but with different relations between them. Each row contains systems in which the relationshipamong the components is the same.moleculescellspeopleRandomCoherentCorrelated

3. Random systems: the behavior of each component is independent from the behavior of all other components.Coherent systems: allcomponents exhibit the same behavior; e.g., the behavior (location, orientation, and velocity) of one part of thecannon ball completely determines the behavior of the other parts. Correlated systems lie between these two extremes:the behaviors of the system’s components do depend on one another, but not so strongly that every component acts in the same way; e.g., the shape of one part of a snowflake is correlated with but does not completely determine the shape of the other parts.

4. Complex SystemA system of large networks of components with no central control & simple rules of operation give rise to complex collective behavior, sophisticated information processing & adaptation via learning or evolutiondoes not yield to compact form of representation & description (e.g., elegant mathematical descriptions, like Maxwell or Newton’s equations) “encodes long histories” (so it is difficult to find compact forms) extracts this information from the environment & uses it to behave adaptivelyAs the system evolves, its components interact, are learning, potentially modifying their behavior, leading to interesting dynamics, emergent behavior In some cases, unpredictable behaviorHave scaling properties (e.g., power laws) or fractal structures

5. A theoretical computer scientist approach: give me a quantity of the system and I can try to tell you how hard is to computationally estimate this quantity in terms of resources, e.g., time, memory, message exchanged (communication), energy.

6. The fat-tailed distribution may appear more stable due to the lower probability ofsmall-scale fluctuations and the fact that samples from the distribution may not contain any extreme events. However, sooner or later, a fat-tailed distribution will produce an extreme event, while one could wait thousands of lifetimes of the universe before a normal distribution produces a similarly extreme event. When the underlying probability distributions have fat tails, standard statistical methods often break down, leading to potentially severe underestimates of the probabilities of extreme events.normal distribution (thin-tailed) & a power-law decay distribution (fat-tailed)The axes of this graph are truncated; the fat-tailed distribution can, with small but non-negligible probability (0.04%), produce events with a scale of one million or more.

7. Thermodynamic & Statistical MechanicsEntropyMeasures the amount of heat loss when energy is transformed to workHeat loss ~ “disorder”Theory is specific to heatMeasures the number of possible microstates that lead to a macrostateNumber of microstates ~ disorderA more general theorySystem’s entropy: a measure of its number of possible states

8. Introduction to EntropySuppose a set of events whose probabilities of occurrence are These probabilities are known but that is all we know concerning which event will occur. Can we find a measure of how uncertain we are of the outcome? That is, what is the surprise factor?

9. TheoremThe constant K merely amounts to a choice of a unit of measureAmount of information per symbol

10. Joint & Conditional EntropyMeasures how uncertain we are of y on the average when we know xThe uncertainty (or entropy) of the joint event x; y is the uncertainty of x plus the uncertainty of y when x is known.The uncertainty of y is never increased by knowledge of x: it decreases, unless x & y are independent events, in which case it does not change.

11. Mutual InformationQuantifies the reduction of uncertainty relative to a X given the knowledge of Y

12. Complexity vs. EntropyComplexity measures related to organizational aspects, the difficulty of describing organizational structureEntropy does not capture the correlation & structure of a system but rather its disorder & inhomogeneity

13. Regular, Complex & Random Systems: Complexity vs. EntropyHighly regular systems present identical structure at all levels: low complexity & low entropyComplex systems present non-repeating structure at multiple levels: high complexity & intermediate entropyRandom systems present no structure at any level: low complexity & high entropy

14. Challenges for Measuring Organized ComplexityMacroscopic predictions for organized complex systems are impossible due to the interactions between a large number of dynamic variables at the microscopic levelThe emergent, self-organizing whole created by the system parts is dependent & comprised of multiple causal models Organized complex systems can not be simply modeled by mathematical formulas, qualitative description or statistics. Instead, new approaches along with new modeling methods of the relationship between complexity metrics & the emergent behavior of those systems are needed to connect the system organization on the micro & macro level.

15. Before quantifying the complexity of a system:How hard is it to describe? How hard is it to create? What is its degree of organization?

16. Organization MeasuresExcess entropy, hierarchical complexity, tree subgraph diversity, correlation, mutual information

17.

18. Scale invariance is an exact form of self-similarity where at any magnification there is a smaller piece of the object that is similar to the whole.FractalsA time developing phenomenon exhibits self-similarity, if the numerical value of certain observable quantity f(x, t), measured at different times are different but the corresponding dimensionless quantity at given value x/t^z remain invariant. Extension of the idea of similarity of two triangles: two triangles are similar if the numerical values of their sides are different but the corresponding dimensionless quantities, such as their angles, coincide.

19. Chaotic BehaviorRefers to a system whose dynamical is very sensitive to the initial conditions.Given a set of the initial conditions for the chaotic system, we can always find other initial conditions arbitrarily nearby that lead to drastic changes in the eventual behavior of the systemVast number, theoretically infinite, of decorrelated signals can be generated with a small variation in the initial conditions of the system.

20. Excess EntropyMeasures the amount of apparent randomness at the micro-level that is “explained away“ by considering correlations over larger & larger blocks. Completely random & fully structured system configurations exhibit low excess entropy, whereas structures with a certain level of organization without pattern repetition on different system scales exhibit high excess entropyMeasures the amount & heterogeneity of statistical correlations within a neural system in terms of the mutual information between subsets of its units. Captures the interplay between global integration & functional segregation, resulting in: high complexity when functional segregation coexists with integration low complexity when the components of a system are either completely independent (segregated) or completely dependent (integrated).Neural Complexity

21. Rigid structure at micro level but larger freedom in larger scales, results to high (positive) excess entropy. Similarly, when we have large freedom in small scales but rigid structure in macro level, we have high (negative) excess entropy. The different density of entropy across different scales is what results in excess entropy.

22. Excess EntropyMeasures the amount of apparent randomness at the micro-level that is “explained away“ by considering correlations over larger & larger blocks. Completely random & fully structured system configurations exhibit low excess entropy, whereas structures with a certain level of organization without pattern repetition on different system scales exhibit high excess entropyMeasures the amount & heterogeneity of statistical correlations within a neural system in terms of the mutual information between subsets of its units. Captures the interplay between global integration & functional segregation, resulting in: high complexity when functional segregation coexists with integration low complexity when the components of a system are either completely independent (segregated) or completely dependent (integrated).Neural Complexity

23. Self-dissimilarityThe degrees of self-dissimilarity between the patterns of a system observed at various scales (e.g. the average matter density of a physical body for volumes at different orders of magnitude).Measures the amount of extra information using a maximum entropy inference of the pattern at one scale, based on the provided pattern on another scale Characterizes the complexity in terms of how the inferences about the whole system differ from one another as one varies the information-gathering space.Scaling of density of entropy…Reflects the change in neural complexity that occurs after a neural system receives signals from the environment. Measures how well the ensemble of intrinsic correlations within a neural system fits the statistical structure of the sensory input.Low when the intrinsic connectivity of a simulated cortical area is randomly organizedHigh when the intrinsic connectivity is modified so as to differently amplify those intrinsic correlations that happen to be enhanced by sensory input.Matching Complexity

24.

25.

26.

27.

28. Complex behaviors from simple rules…

29.

30. Examples of Synchronization in NatureFireflies flashingCrickets chirpingNeurons firingHeart cells beating

31.

32.

33.