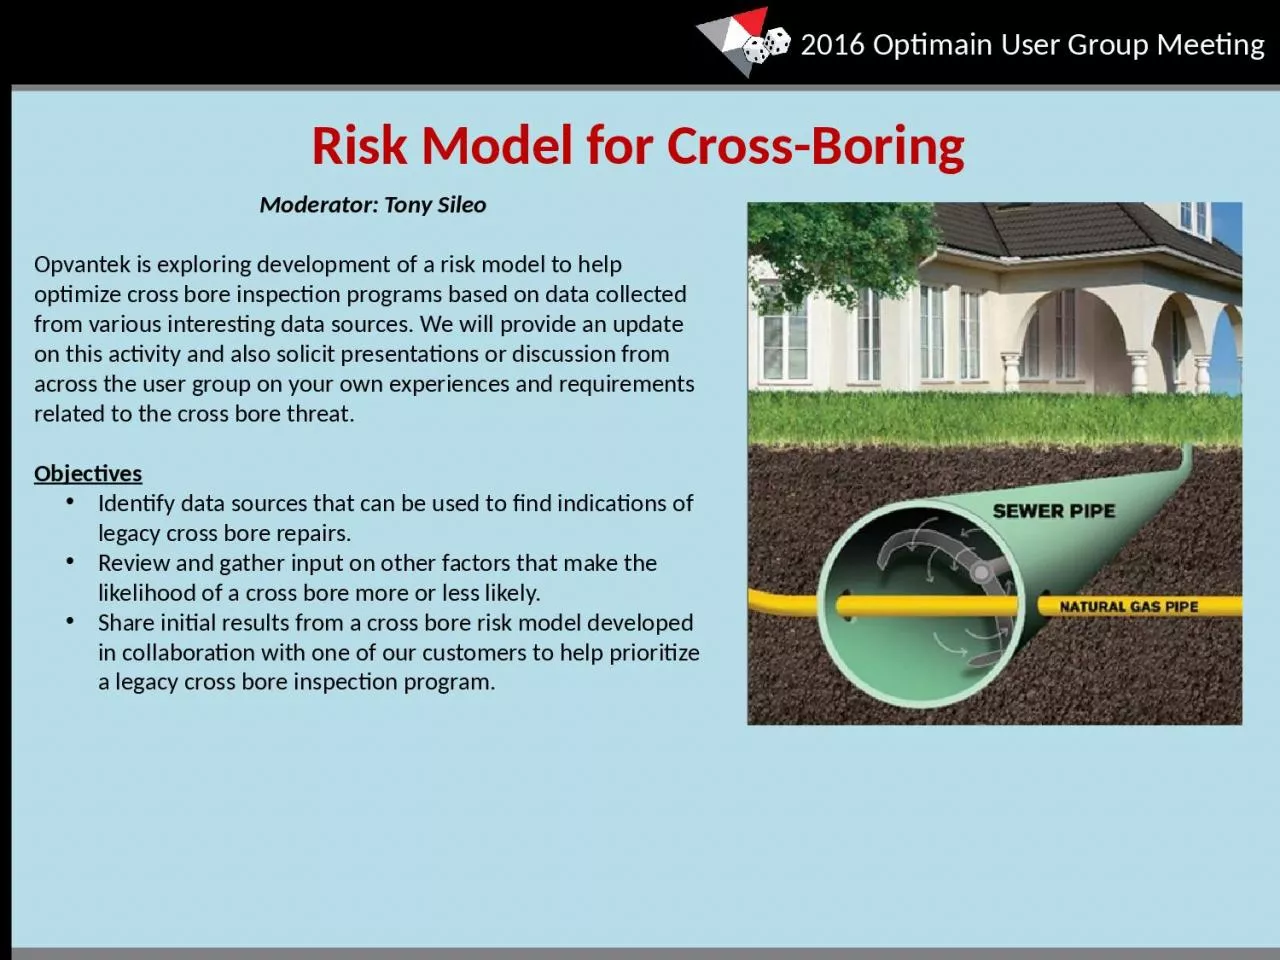
/
Moderator:  Tony Sileo Opvantek is exploring development of a risk model to help optimize Moderator:  Tony Sileo Opvantek is exploring development of a risk model to help optimize

Moderator: Tony Sileo Opvantek is exploring development of a risk model to help optimize - PowerPoint Presentation

winnie
winnie . @winnie
Follow
66 views
Uploaded On 2023-09-26

Moderator: Tony Sileo Opvantek is exploring development of a risk model to help optimize - PPT Presentation

Objectives Identify data sources that can be used to find indications of legacy cross bore repairs Review and gather input on other factors that make the likelihood of a cross bore more or less likely ID: 1021440

bore cross data risk cross bore risk data work svcs xbored map install trenchless orders bores main service density

Share:

Link:

Embed:

Download Presentation from below link

Download Presentation The PPT/PDF document "Moderator: Tony Sileo Opvantek is explo..." is the property of its rightful owner. Permission is granted to download and print the materials on this web site for personal, non-commercial use only, and to display it on your personal computer provided you do not modify the materials and that you retain all copyright notices contained in the materials. By downloading content from our website, you accept the terms of this agreement.


Presentation Transcript

1. Moderator: Tony SileoOpvantek is exploring development of a risk model to help optimize cross bore inspection programs based on data collected from various interesting data sources. We will provide an update on this activity and also solicit presentations or discussion from across the user group on your own experiences and requirements related to the cross bore threat.ObjectivesIdentify data sources that can be used to find indications of legacy cross bore repairs.Review and gather input on other factors that make the likelihood of a cross bore more or less likely.Share initial results from a cross bore risk model developed in collaboration with one of our customers to help prioritize a legacy cross bore inspection program.Risk Model for Cross-Boring

2. GOAL – risk score to prioritize legacy cross bore inspection programCustomer had built a preliminary model (keyword data mining)Gathered SME input on potential data sourcesExtracted legacy work orders and customer dispatch orders from data warehouseIncorporated enhanced GIS data from Optimain DSBuilt and reviewed 10 iterations of the model Building the Cross Bore Risk Model

3. Gas Main Features (GIS and Optimain DS)Service Line Records (GIS, Optimain DS and Service Card System)Repair Work Orders (WMS)Pipe Install/Replace Work Orders (WMS)Customer Service Orders (DIS)Cross Bore Logs – workbooks by stateCross Bore Inspected Areas – MS Word documentsSummary of Data Used

4. Work Order Job Types

5. Search comment fields for word patterns that might indicate a cross-bore was repaired10 million records … 876 possible cross boresEstablish HistoricMapId’sCross Bore Repair Keywords

6. Install/Replace Pipe Work OrdersSearch for Trenchless Technology keywords in commentsEstablish HistoricMapId’sPossible Trenchless Tech Install Work Orders

7. Also found 192 possible cross bore repairs from nearly 900,000 customer dispatch ordersCustomer Service x-Bore Repairs

8. Customer Svc Work Orders with Trenchless Tech KeywordsCustomer Service Trenchless Tech Install Indications

9. Cleansed and aligned with Municipality and StreetName values from GIS (as captured on GIS Main Features in Optimain DS)Cross Bore Log Data

10. Computed for two different geographic areasHistoricMapId (“Map”)HistoricMapId + StreetName (“StreetMap”) For each area with at least Y x-Bores, how many have at least one more? How many more did each area have?Sum over all areas – use to establish a-priori probability algorithmsProbability of at least one more x-Bore in the same areaExpected number of additional x-Bores in the same area (“EV”)X-Bore Probability Algorithms

11. Probability and Expected # Xbores by Map (v10)

12. # of Mains Possibly Installed with Trenchless Tech (vintage, mat’l)# of Mains with XBores on Install Job# of Services Possibly Installed with Trenchless Tech (vintage)# of Services with Long Company Side# of Services Initially Installed Since 1970# of Services Replaced Since 1970# of Services with Work Order indicating Trenchless Tech InstallAll factors normalized to percent of maximum# in this area / maximum from any areaProbability Factors

13. Factor Weights optimized to maximize correlation of Prob Score with Actual Cross Bores FoundProbability Scores (Map or StreetMap)Prob ScoreFactor 1 WeightFactor 1 ScoreFactor 2 WeightFactor 2 ScoreFactor n WeightFactor n ScoreSum of all Factor Weights

14. Weights tuned manually to use the StreetMap level EV and ProbScores to rank risk among all Streets that are on Maps with greater than the average number of expected additional cross bores. Does NOT use the Map ProbScore in the final algorithm since we’re only looking at maps that already have a number of reported cross bores somewhere on the map.Final Risk Algorithm - High EV StreetMapsFinal Risk ScoreProbability ScoreConsequence ScoreProbability ScoreMapEVMapEV Weight (3.0)StreetMapEVStreetMapEV Weight (100.0)StreetMap ProbScoreStreetMap ProbScore Weight (10.0)Consequence ScorePop Density FactorMax Pop Density This StreetMapAvg Pop Density All Census Block Groups in State

15. Weights established manually to use only Map and StreetMap ProbScores to rank risk among all Streets that are on Maps with fewer than the average number of expected additional cross bores, but with higher than average Map Prob Scores.Does NOT use the EV’s since these are all in Maps (and thus StreetMaps) with very few prior reported cross bores (thus, all EV’s are low or 0).Final Risk Algorithm - High FactorScore StreetMapsFinal Risk ScoreProbability ScoreConsequence ScoreConsequence ScorePop Density FactorMax Pop Density This StreetMapAvg Pop Density All Census Block Groups in StateProbability ScoreMap ProbScoreMap ProbScore Weight (10.0)StreetMap ProbScoreStreetMap ProbScore Weight (20.0)

16. Example Scoring Illustration2nd Ave3rd AveNewkirk Dr (EV=0.38, Factor Score=70.6)Kingsdale Blvd (EV=0, Factor Score=57.6)Ridgewood Dr (EV=0.38, Factor Score=84.3)1st AveMap 7436580IMapEV = 1.51Factor Score = 257PopDensity = 2.8Cross Bore FoundPossibly Xbored Mains: 4Mains w/ xB On Install Job: 2Possibly Xbored Svcs: 42Long Side Svcs: 35Svcs Inst Since ‘70: 0Svcs Repl Since ‘70: 42TT Inst Svcs: 0Possibly Xbored Mains: 39Mains w/ xB On Install Job: 6Possibly Xbored Svcs: 32Long Side Svcs: 7Svcs Inst Since ‘70: 32Svcs Repl Since ‘70: 0TT Inst Svcs: 0Possibly Xbored Mains: 2Mains w/ xB On Install Job: 2Possibly Xbored Svcs: 68Long Side Svcs: 34Svcs Inst Since ‘70: 67Svcs Repl Since ‘70: 1TT Inst Svcs: 1

17. Positively map every cross bore indicationRelate every xBore indication that was due to a service line to the current service at that address (by premise ID)Relate every xBore indication that was due to a main line to the current main or abandoned main feature at that address (by GISID). If more than one main, relate to the one that was xBored, or that replaced the one that was xBored (if no abandoned main found).Positively identify every area that has been inspected or reviewed and deemed to be safe (office cleared)Polygon feature on map Capture well-defined StreetName, Municipality, HistoricMapID, FromStreetName, ToStreetNameEstablish a way to positively mark or track any historic work order that indicates a cross-bore occurred (Yes, Maybe, No, Not Reviewed).Recommended Data Improvements