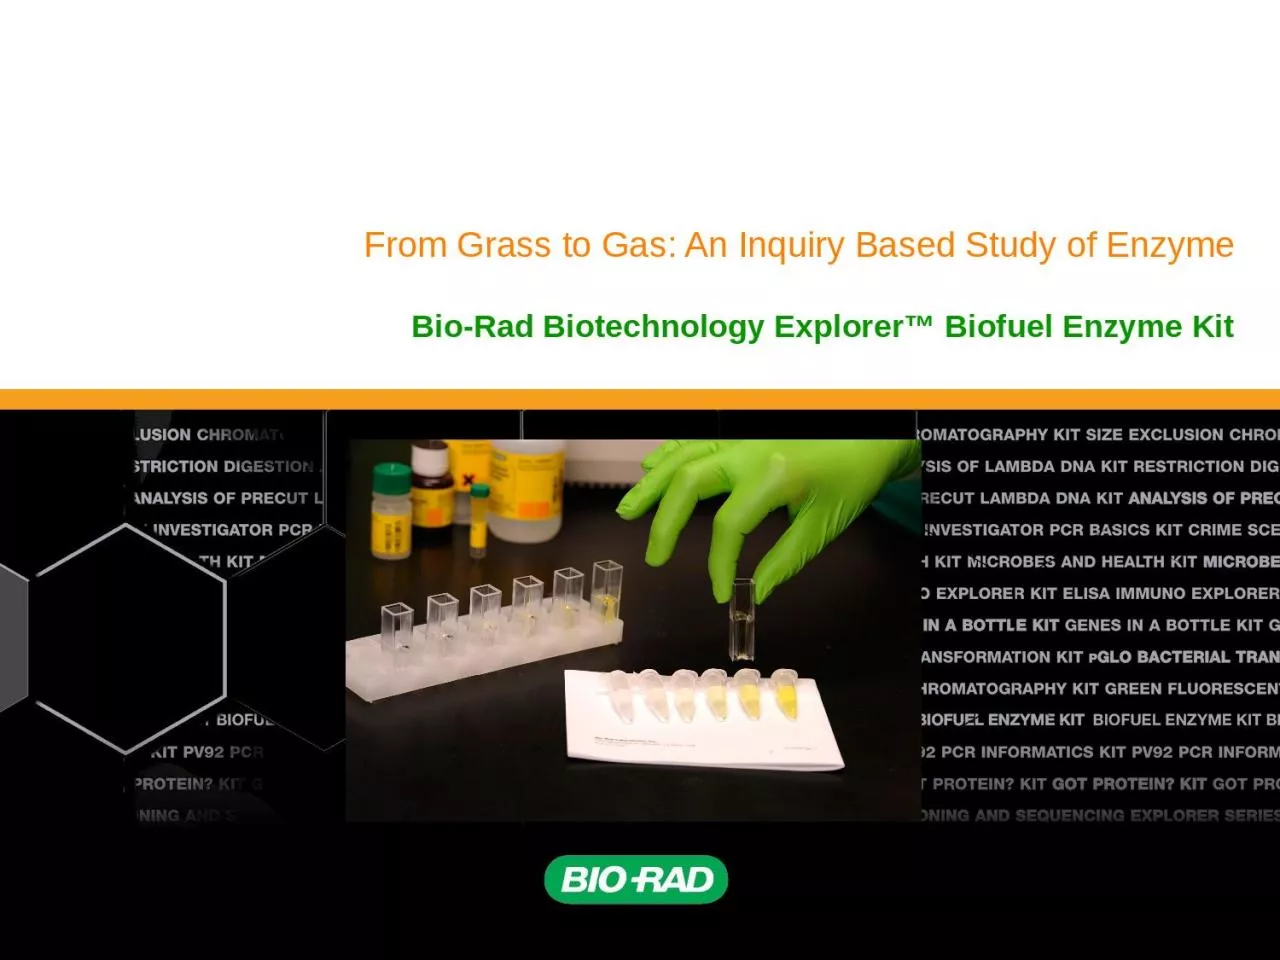
/
From Grass to Gas: An Inquiry Based Study of Enzyme From Grass to Gas: An Inquiry Based Study of Enzyme

From Grass to Gas: An Inquiry Based Study of Enzyme - PowerPoint Presentation

ximena
ximena . @ximena
Follow
346 views
Uploaded On 2022-06-11

From Grass to Gas: An Inquiry Based Study of Enzyme - PPT Presentation

BioRad Biotechnology Explorer Biofuel Enzyme Kit Instructors BioRad Curriculum and Training Specialists Sherri Andrews PhD Eastern US sherriandrewsbioradcom Damon Tighe ID: 917274

effect enzyme reaction kit enzyme effect kit reaction substrate biofuel std concentration rate activities bio curve prospecting activity celliobiase

Share:

Link:

Embed:

Download Presentation from below link

Download Presentation The PPT/PDF document "From Grass to Gas: An Inquiry Based Stud..." is the property of its rightful owner. Permission is granted to download and print the materials on this web site for personal, non-commercial use only, and to display it on your personal computer provided you do not modify the materials and that you retain all copyright notices contained in the materials. By downloading content from our website, you accept the terms of this agreement.


Presentation Transcript

Slide1

From Grass to Gas: An Inquiry Based Study of Enzyme

Bio-Rad Biotechnology Explorer™ Biofuel Enzyme Kit

Slide2

Instructors - Bio-Rad Curriculum and Training Specialists

Sherri Andrews, Ph.D., Eastern US sherri_andrews@bio-rad.com

Damon

Tighe

,

Western US

damon_tighe@bio-rad.com

Leigh Brown, M.A

., Central US

leigh_brown@bio-rad.com

Slide3

What are enzymes?

Molecules, usually proteins, that speed up the rate of a reaction by decreasing the activation energy required without themselves being altered or used up

Enzyme Class

Example

Oxidoreductase

(transfer of electrons)

Firefly Luciferase – oxidizes luciferin to produce oxyluciferin and lightTransferase(group-transfer reactions)Hexokinase – transfers a phosphate group to glucose to make glucose-6-phosphateHydrolase(hydrolysis reactions)Cellobiase – breaks down cellobioseLyase(double bond reactions)Histidine decarboxylase – generates histimine from histidineIsomerase(transfers to create a new isomers)Glucose-6-Phosphate isomerase – converts G-6-P to fructose-6-phosphateLigase(forms covalent bonds)DNA Ligase – covalently bonds two pieces of DNA

Background - Enzymes

Slide4

How do enzymes work?

Substrate (S)

Product (P)

ENERGY

REACTION COORDINATE

SPS*

E

act

S*

enz

E

act

Enzyme

Background - Enzymes

Slide5

How do enzymes work?

Substrate free in solution

Substrate binds to a specific cleft or groove in the enzyme

Activation energy barrier is overcome and reaction occurs

Product is released and enzyme is free to catalyze another reaction

Background - Enzymes

Slide6

What are biofuels?

Biodiesel

Ethanol from starches/sugars

Cellulosic ethanol

Butanol

Fuels that are produced from a biological source Oil – biofuel, but very long production cycle (millions of years)Short cycle BiofuelsBackground - Biofuels

Slide7

Cellulosic ethanol production

A

B

C

D

Background - Biofuels

Slide8

Cellobiase

Exocellulases

Endocellulases

Glucose

1. Heat, acid, ammonia or other treatment

2. Enzyme mixture added

Cellulose breakdown

Background – Biofuels production

Slide9

+

Cellobiose

breakdown- a closer look

Cellobiose + H

2

O 2 Glucose

415

6

4

2

3

1

Background -

cellobiose

Slide10

Protocol Highlights:

Using a colorimetric substrate to track reaction rate

Cellobiose

and glucose are colorless when dissolved

cellobiosep-nitrophenyl glucopyranoside• modified substrate colorimetric detectionBackground – cellobiase detection system

Slide11

Cellobiase

breakdown of p

-

nitrophenyl

glucopyranoside

+p-nitrophenyl glucopyranoside + H2O glucose + p-nitrophenolBasic conditionsClearYellow

Background –

cellobiase

detection system

Slide12

How can this enzymatic reaction be easily quantified?

Basic solution (STOP SOLUTION):

- will develop color of any

p

-

nitrophenol

present - will stop the reactionQualitative – Visually Compare vs p-nitrophenol Standards Quantitative- read absorbance at 410 nm using a spectrophotometer or microplate reader. Background – cellobiase detection system

Slide13

Biofuel Enzyme kit Activity 1

Slide14

SmartSpec™ Plus

170-2525EDU

Photodiode Array UV-VIS Spectrometer

Measures

Absorbance , %T

Specifications Range: 200-800 nmOptical Resolution: ± 2 nmLight Source: Xenon Flash LampPower: 120 VAC, 60 HzStandalone Research Grade Instrument Biofuel Enzyme kit Activity 1

Slide15

Biofuel Enzyme Kit

Procedure Overview

Activities:

Reaction Rate & Std curve

Effect of Temperature

Effect of pH

Effect of Enzyme ConcentrationEffect of Substrate ConcentrationBio-prospecting for Celliobiase Collaborative approach:Each student group does activity 1Student groups do one activity each from 2-5Groups share dataAll groups do activity 6 and share dataBiofuel Enzyme kit Activities

Slide16

Standard

Amount of

p

-nitrophenol (nmol)

Absorbance

410 nm

S100S212.50.2S3250.4S4500.8S5100

1.6

Std curve / Std Reaction Rate

E

ffect of Temperature

Effect of pH

Effect of Enzyme Concentration

Effect of Substrate Concentration

Bio-prospecting for Celliobiase

Biofuel Enzyme kit Activities

Slide17

Std curve / Std Reaction Rate

E

ffect of Temperature

Effect of pH

Effect of Enzyme Concentration

Effect of Substrate Concentration

Bio-prospecting for Celliobiase Biofuel Enzyme kit Activities

Slide18

Initial reaction rate =

Amount of

p

-nitrophenol produced (nmol)

Time (min)

Initial reaction rate =

50 nmol - 0 nmol4 min - 0 min = 12.5 nmol/min

Std curve / Std Reaction Rate

E

ffect of Temperature

Effect of pH

Effect of Enzyme Concentration

Effect of Substrate Concentration

Bio-prospecting for Celliobiase

Biofuel Enzyme kit Activities

Slide19

Std curve / Std Reaction Rate

E

ffect of Temperature

Effect of pH

Effect of Enzyme Concentration

Effect of Substrate Concentration

Bio-prospecting for Celliobiase Biofuel Enzyme kit Activities

Slide20

Initial reaction rate =

Amount of

p

-nitrophenol produced (nmol)

Time (min)

This is the amount of

p-nitrophenol produced in 2 minutesStd curve / Std Reaction RateEffect of TemperatureEffect of pHEffect of Enzyme ConcentrationEffect of Substrate ConcentrationBio-prospecting for Celliobiase Biofuel Enzyme kit Activities

Slide21

Amount of

p

-nitrophenol formed (nmol)

Time (minutes)

1. The initial reaction rate is faster when there is a higher enzyme concentration

High enzyme concentration

Low enzyme concentration

2. Given enough time, the same amount of product will be formed for both the high and low enzyme concentration reactions

Std curve / Std Reaction Rate

E

ffect of Temperature

Effect of pH

Effect of Enzyme Concentration

Effect of Substrate Concentration

Bio-prospecting for Celliobiase

Biofuel Enzyme kit Activities

Slide22

Amount of

p

-nitrophenol formed (nmol)

Time (minutes)

0.25 mM substrate [Low]

1.5 mM substrate [High]

1. Effect of substrate concentration on the initial rate

2. Final amount of product formed with varying substrate concentrations

Std curve / Std Reaction Rate

E

ffect of Temperature

Effect of pH

Effect of Enzyme Concentration

Effect of Substrate Concentration

Bio-prospecting for Celliobiase

Biofuel Enzyme kit Activities

Slide23

Where can we find things that break down cellulose?

Std curve / Std Reaction Rate

E

ffect of Temperature

Effect of pH

Effect of Enzyme Concentration

Effect of Substrate ConcentrationBio-prospecting for Celliobiase Biofuel Enzyme kit Activities

Slide24

Mushrooms – Ecological niche for food

Mycorrhizal

–associated with plant roots

Porcini

Chanterelle

Saprotrophic – decomposers

ShiitakeMorelButtonParasitic – attacks plantsHoney MushroomStd curve / Std Reaction RateEffect of TemperatureEffect of pHEffect of Enzyme ConcentrationEffect of Substrate ConcentrationBio-prospecting for Celliobiase Biofuel Enzyme kit Activity 6

Slide25

Biofuel Enzyme kit Activities

Using a Micropipette

Plunger

Tip Ejector

Two stops

1

st – defines volume2nd – ejects volume

Slide26

Pick a mushroom

Add ~ 0.25g of mushroom to

microcentrifuge

tube

crush with blunted pipette tip

Add 1,000 µl extraction buffer and continue crushing

Spin down extract in microcentrifuge to separate mushroom particles from liquid fraction or filter and put liquid fraction in new centrifuge tube (~250ul)Activity 6Protocol

Biofuel Enzyme kit Activities

Slide27

6.

Label microplate wells 1-6

7.

Add 100ul of Stop solution to wells 1-6

8.

Label a 2ml centrifuge tube with your initials and

add 1.5ml of substrateActivity 6Protocol

Biofuel Enzyme kit Activities

Slide28

Activity 6

Protocol

9.

Add 125ul of mushroom extract to substrate and start your clock.

10.

At the appropriate times remove 100ul from your reaction and add it to the corresponding well of your

microplate. Make sure to mix.11. To make an appropriate blank, add 92ul of extraction buffer to well 6 and 8 ul of mushroom extract. Biofuel Enzyme kit Activities

Slide29

Activity 6

Protocol

Read samples on

iMARK

Platereader

Reads 400-750nmReads 96 samples in under 10 secondsOnboard printer, but best to connect to sofoware for easy data manipulationCan do kinetics, plate shaking, etcBiofuel Enzyme kit Activities

Slide30

Standard

Amount of

p

-nitrophenol (nmol)

Absorbance

410 nm

S100S212.50.2S3250.4S4500.8S5100

1.6

Std curve / Std Reaction Rate

E

ffect of Temperature

Effect of pH

Effect of Enzyme Concentration

Effect of Substrate Concentration

Bio-prospecting for Celliobiase

Y = mx + b, solve for X

M = slope

b = y-intercept (can use 0 for ease)

Biofuel Enzyme kit Activity 6

Slide31

Std

curve /

Std

Reaction Rate

E

ffect of Temperature

Effect of pHEffect of Enzyme ConcentrationEffect of Substrate ConcentrationBio-prospecting for Celliobiase X = (y-b)/m Derive p-nitrophenol concentrations from Abs data TimeAbsorbance410 nmAmount of p-nitrophenol (nmol)#1 – 1 min#2 – 2 min#3 – 4 min

#4 – 6 min

#5 – 8 min

#6 - Blank

Biofuel Enzyme kit Activity 6

Slide32

Further Studies (not in kit)

SDS PAGE Gel of mushroom extracts

shiitake

Beech

Chicken of the Woods

Oyster

King OysterLion’s ManeChanterelle

Aspergillus niger

Kaleidoscope marker

Aspergillus

niger

has 3

cellobiases

at 88, 80, 71KD in the

literature

.

Chanterelle is

mycorrhizal

, has no activity when assayed and no bands in

cellobiase

range

Mushroom samples above were dried cubes

Biofuel Enzyme kit – Further Studies

Slide33

Cross curriculum approach

Social Studies

– debate biofuels

Environmental Science

– effects of biofuel production /global warming

Environmental Science

– do the bio-prospectingHistory – history of oil and other fuelsEngineering – research paper on how biofuels fit with oil infrastructure