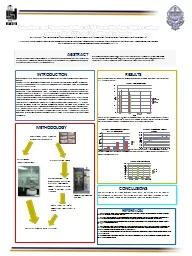
KhanhHuuThe Dam University Paris Diderot and LIPN Tayssir Touili LIPN CNRS and University Paris 13 Motivation Symantec reported 317M malwares in 2014 vs 431M malwares in 2015 More than ID: 774757
Download Presentation The PPT/PDF document " Automatic Extraction of Malicious Behav..." is the property of its rightful owner. Permission is granted to download and print the materials on this web site for personal, non-commercial use only, and to display it on your personal computer provided you do not modify the materials and that you retain all copyright notices contained in the materials. By downloading content from our website, you accept the terms of this agreement.
Slide1
Automatic Extraction of Malicious Behaviors
Khanh-Huu-The DamUniversity Paris Diderot and LIPN
Tayssir
Touili
LIPN, CNRS and University Paris 13
Slide2Motivation
Symantec reported:
317M malwares in 2014 vs. 431M malwares in 2015
More than 1M new malwares released everyday
Increased by 36% in one year
Malware detection
is a big challenge.
2
/46
Slide3Malicious Behavior Extraction
Extracting malicious behaviors requires a huge amount of engineering effort.a tedious and manual study of the code.a huge time for that study.
The main challenge is
how to make this step automatically.
3
/46
Slide4Our goal is …
To extract
automatically the malicious behaviors!
4
/46
Slide5How does a malicious behavior look like!!
Model Malicious Behaviors
How ?
What is a good model for a malicious behavior??
5
/46
Slide6Transfer data from Internet into a file stored in the system folder, then execute this file.
Trojan Downloader
n15 push 0FEhn16 push offset dword_4097A4n17 call GetSystemDirectoryAn18 push 0n19 push 0n20 lea eax, [ebp-1Ch]n21 mov ebx, eaxn22 push ebxn23 push eaxn24 push 0n25 call URLDownloadToFileAn26 push 5n27 call sub_4038B4n28 push ebxn29 call WinExec
*This code is extracted from Trojan-Downloader.Win32.Delf.abk
6
/46
Slide7n15 push 0FEhn16 push offset dword_4097A4n17 call GetSystemDirectoryAn18 push 0n19 push 0n20 lea eax, [ebp-1Ch]n21 mov ebx, eaxn22 push ebxn23 push eaxn24 push 0n25 call URLDownloadToFileAn26 push 5n27 call sub_4038B4n28 push ebxn29 call WinExec
Trojan Downloader
Get the path of the system folder.
Transfer data from
an URL address into a file.
Executing this file in the system
folder.
GetSystemDirectoryA
URLDownloadToFileA
WinExec
Malicious API graph
How to extract such graph automatically!!!
7
/46
Slide8…n1 push offset Textn2 push 0n3 call MessageBoxA…n4 push 0FFFFFFF5hn5 call GetStdHandlen6 push eaxn7 call WriteFile…n8 push offset dword_4097A4n9 call GetSystemDirectoryA…n10 push 0n11 call URLDownloadToFileA…n12 push ebxn13 call WinExec
Modeling a program
*An assembly code of Trojan-Downloader.Win32.Delf.abk
n
3
,
MessageBoxA
n
5
,
GetStdHandle
n7, WriteFile
n9, GetSystemDirectoryA
n11, URLDownloadToFileA
n13, WinExec
The API call graph
An API call graph represents the order of execution of the different API functions
in a
program.
8
/46
Slide9…n1 push offset Textn2 push 0n3 call MessageBoxA…n4 push 0FFFFFFF5hn5 call GetStdHandlen6 push eaxn7 call WriteFile…n8 push offset dword_4097A4n9 call GetSystemDirectoryA…n10 push 0n11 call URLDownloadToFileA…n12 push ebxn13 call WinExec
Modeling a program
*An assembly code of Trojan-Downloader.Win32.Delf.abk
n3, MessageBoxA
n5, GetStdHandle
n7, WriteFile
n9, GetSystemDirectoryA
n11, URLDownloadToFileA
n13, WinExec
The API call graph
The malicious
behavior !!!
Our goal is to extract such malicious behavior from this graph.
9
/46
Slide10How to extract malicious behaviors?
Set of malwares
Set of benwares
API call graphs
API call graphs
Malicious API graphs
Our goal:
Isolate the few relevant subgraphs (in malwares) from the nonrelevant ones (in benwares).
This is an Information Retrieval (IR) problem.
10
/46
Slide11IR Problem vs. Our Problem
Retrieve relevant documents and reject nonrelevant ones in a collection of documents.
Isolate the few relevant subgraphs (in malwares) from the nonrelevant ones (in benwares).
IR Problem
Our Problem
11
/46
Slide12Information Retrieval Community
Extensively studied the problem over the past 35 years.Information Retrieval (IR) consists of retrieving documents with relevant information from a collection of documents. Web search, email search, etc.Several techniques that were proven to be efficient.
12
/46
Slide13Adapt and apply this knowledge and experience of the IR community to our malicious behavior extraction problem.
Our goal is …
13
/46
Slide14Information Retrieval
Information retrieval research has focused on the retrieval of text documents and images.based on extracting from each document a set of terms that allow to distinguish this document from the other documents in the collection.measure the relevance of a term in a document by a term weight scheme.
14
/46
Slide15Term weight scheme in IR
The term weight represents the relevance of a term in a document.The higher the term weight is, the more relevant the term is in the document.A large number of weighting functions have been investigated.The TFIDF scheme is the most popular term weighting in the IR community.
15
/46
Slide16Basic TFIDF scheme
The TFIDF term weight is measured from the occurrences of terms in a document and their appearances in other documents.
w (i,j) = tf(i,j) x idf(i) w (i,j) : the weight of term i in document j. tf(i,j) : the frequency of term i in document j. idf(i) : the inverse document frequency of term i. idf(i) = log( N/df(i))
df(i) is the number of documents containing term i.
N is the size of the collection.
16
/46
Slide17Properties of TFIDF scheme
A term is relevant to a document if it occurs frequently in this document and rarely appears in other documents.Words are terms in a document.Common words like “the”, “a”, “with”, “of”, etc. are terms that can be found in every document are irrelevant.
17
/46
Slide18Term frequencies are usually bigger for longer documents.For ranking, a document with a higher tf for a relevant term is not placed ahead of other documents which have multiple relevant terms.Adjust the term frequency by a function F
F( tf) takes into account the long document normalization and ensures the high rank for relevant documents.
Basic TFIDF Scheme Issues
w (i,j) = F( tf(i,j)) x idf(i)
18
/46
Slide19Some Functions of Term frequency
Depending on the application, one function can be better than the others.
19
/46
Slide20How to apply to our graphs ?
Documents
Terms are words
Graphs
A
B
C
Terms are nodes or edges
Term weights of words
Term weights of nodes or edges
The relevant
graph consists of relevant nodes and edges.
20
/46
Slide21Weight of term (node or edge) i in graph j is computed by
How to apply to our graphs ?
w (i,j) = F( tf(i,j)) x idf(i) tf(i,j) : the frequency of term i in graph j. idf(i) : the inverse graph frequency of term i. idf(i) = log( N/df(i))
df(i) is the number of graphs containing term i.
N is the size of the collection.
21
/46
Slide22Relevance of a term in a graph
Given term
i(node or edge)
API call graphs
Malware graph set M
API call graphs
Benware graph set B
Graph m1, m2, …
Graph b1, b2 …
Relevance ?
Relevance of term
i
to graph m
j
Relevance of term
i
to graph b
j
22
/46
Slide23Relevance of a term in a set
Given term i(node or edge)
API call graphs
Malware graph set M
API call graphs
Benware graph set B
Graph m1, m2, …
Graph b1, b2 …
Relevance ?
Relevance of term
i
in Malwares
Relevance of term
i
in Benwares
23
/46
Slide24Relevance of a term w.r.t M and B
Given term i(node or edge)
API call graphs
Malware graph set M
API call graphs
Benware graph set B
How is a term relevant in
M
and not in
B
?
W(i,M,B)
is high when
W(i,M)
is high and
W(i,B)
is low.
24
/46
Slide25Relevance of a term w.r.t M and B:Rocchio weight
Measured by the distance between the weight of i in the set M and its weight in the set B. W(i,M,B) is high if W(i,M) is high and W(i,B) is low.
Values to adjust the effect of term weights in
M
and in
B
.
Normalizing term weights by the size of the collection.
25
/46
Slide26Relevance of a term w.r.t M and B:Ratio weight
Measured by the ratio of the weight of term i in M and its weight in B. This is a kind of quotient between W(i,M) and W(i,B). W(i,M,B) is high if W(i,M) is high and W(i,B) is low.
To
avoid
a problem in case W(i,B)=0
.
Normalizing term weights by the
size
of the collection.
26
/46
Slide27Relevance of a term w.r.t M and B
For each term
(node or edge) i
API call graphs
Malware graph set M
API call graphs
Benware graph set B
The
high
weight
means term i is relevant to
M
and
not to
B.
How to use the term weight to extract malicious graphs?
27
/46
Slide28Construct malicious API graphs
A malicious API graph consists of nodes and edges with the highest weight.How to link all these nodes and edges in a graph.
There are different possibilities for
computing such graph.
28
/46
Slide29Strategy S0
Take n nodes with the highest weight, for n given by the user.Choose out-going edges with the highest weight to connect these nodes.
Graphs
A
B
C
A
Edges with the highest weight
Nodes with the highest weight
Edges connecting nodes
n = 3
29
/46
Slide30Strategy S0
Take n nodes with the highest weight, for n given by the user.Choose out-going edges with the highest weight to connect these nodes.
Graphs
A
B
C
A
Edges with the highest weight
Nodes with the highest weight
Edges connecting nodes
n = 3
30
/46
Slide31Strategy S0
Take n nodes with the highest weight, for n given by the user.Choose out-going edges with the highest weight to connect these nodes.
Graphs
A
B
C
A
Edges with the highest weight
Nodes with the highest weight
Edges connecting nodes
n = 3
31
/46
Slide32Strategy S1
Take n nodes with the highest weight, for n given by the user.Choose edges with the highest weight that start from one of these nodes.
Graphs
A
B
C
A
Edges with the highest weight
Nodes with the highest weight
Edges connecting nodes
D
Nodes in the graph
D
n = 3
32
/46
Slide33Strategy S1
Take n nodes with the highest weight, for n given by the user.Choose edges with the highest weight that start from one of these nodes.
Graphs
A
B
C
A
Edges with the highest weight
Nodes with the highest weight
Edges connecting nodes
D
Nodes in the graph
D
n = 3
33
/46
Slide34Strategy S1
Take n nodes with the highest weight, for n given by the user.Choose edges with the highest weight that start from one of these nodes.
Graphs
A
B
C
A
Edges with the highest weight
Nodes with the highest weight
Edges connecting nodes
D
Nodes in the graph
D
E
n = 3
34
/46
Slide35Strategy S2
Take n nodes with the highest weight, for n given by the user.Choose paths with the highest weight to connect each pairs of these nodes.
Graphs
A
B
C
A
Edges on the path with the highest weight
Nodes with the highest weight
Edges connecting nodes
D
Nodes in the graph
D
n = 3
35
/46
Slide36Strategy S3
Take n edges with the highest weight, for n given by the user.
Graphs
A
B
C
A
Edges with the highest weight
Nodes with the highest weight
Edges connecting nodes
Nodes in the graph
D
E
D
n = 3
36
/46
Slide37Summary
For each term
(node or edge) i
API call graphs
Malware graph set M
API call graphs
Benware graph set B
The higher weight
means term i is relevant to
M
and
not to
B.
We use these weights
to compute malicious graphs by using different strategies.
37
/46
Slide38Does the program contain any malicious behavior ?
How to detect malwares?
Training set
(malwares + benwares)
Malicious API graphs
A new program
API
call graph
Check common paths
Malware
Benware
How our graphs can be used for malware detection?
Yes
No
38
/46
Slide39Experiments
Apply on a dataset of 1980 benign programs and 3980 malwares collected from Vx Heaven.Training set consists of 1000 benwares and 2420 malwares extract malicious graphs.Test set consists of 980 benwares and 1560 malwares for evaluating malicious graphs.Evaluate different strategies and formulas.
39
/46
Slide40Performance Measurement
High recall means that most of the relevant items were computed. High precision means that the technique computes more relevant items than irrelevant.
(Detection rate)
40
/46
Slide41Performance Measurement
F-Measure is a harmonic mean of precision and recall.F-Measure is 1 if all retrieved items are relevant and all relevant items have beenretrieved.
41
/46
Slide42Evaluating the performance of the different strategies
The best performance of each strategy.
42
/46
Slide43Evaluating the performance of the different strategies
The best performance of each strategy.
The best performance is the Rocchio equation, strategy S0, formula F3, and n = 85.
43
/46
Slide44Comparison with well-known antiviruses
Detect new unknown malwares180 new malwares generated by NGVCK, RCWG and VCL32 which are the best known virus generators.32 new malwares from Internet*.
* https://malwr.com/
44
/46
Slide45Comparison with well-known antiviruses
A comparison of our method against well-known antiviruses.
45
/46
Slide46Summary
Apply TFIDF scheme for extracting automatically malicious behaviors from the collection of malwares and benwares.Compare different formulas and strategies.Detection rate is 99.04 %.Our tool is able to detect malwares that well-known antiviruses could not detect.
46
/46
Slide47Thank you!