PPT-Classification of Stellar Spectra
Author : yoshiko-marsland | Published Date : 2017-04-20
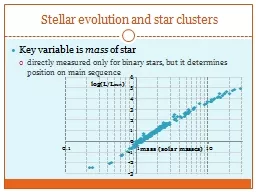
Essentially all stars appear as point sources Only differences are brightness and spectra Many differences in spectra due to temperature Pseudo blackbody with chromosphere
Presentation Embed Code
Download Presentation
Download Presentation The PPT/PDF document "Classification of Stellar Spectra" is the property of its rightful owner. Permission is granted to download and print the materials on this website for personal, non-commercial use only, and to display it on your personal computer provided you do not modify the materials and that you retain all copyright notices contained in the materials. By downloading content from our website, you accept the terms of this agreement.
Classification of Stellar Spectra: Transcript
Download Rules Of Document
"Classification of Stellar Spectra"The content belongs to its owner. You may download and print it for personal use, without modification, and keep all copyright notices. By downloading, you agree to these terms.
Related Documents