/
NATIONAL DROWNING REPORT 2014ROYAL LIFE SAVING NATIONAL DROWNING REPORT 2014ROYAL LIFE SAVING

NATIONAL DROWNING REPORT 2014ROYAL LIFE SAVING - PDF document

yoshiko-marsland
yoshiko-marsland . @yoshiko-marsland
Follow
394 views
Uploaded On 2015-08-25

NATIONAL DROWNING REPORT 2014ROYAL LIFE SAVING - PPT Presentation

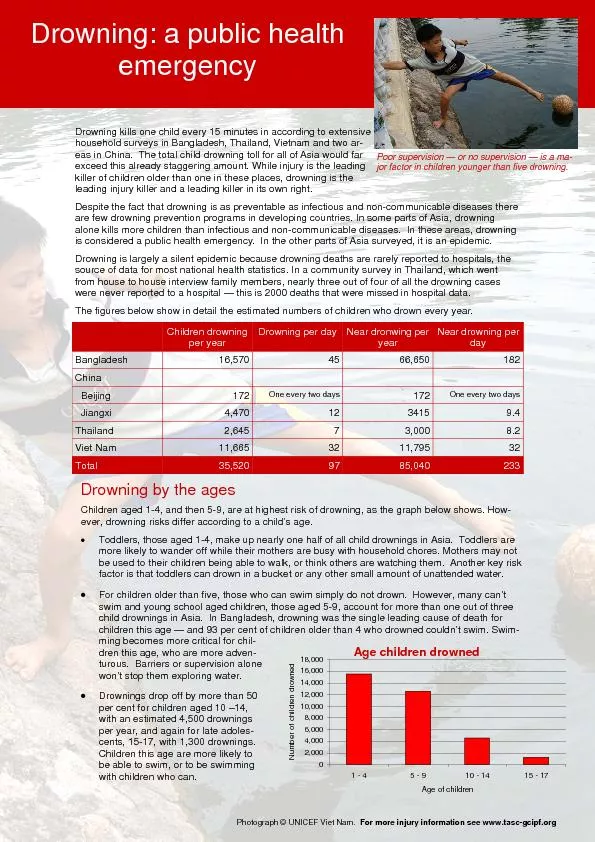
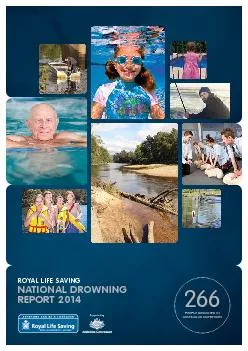
AUSTRALIAN WATERWAYS Supported by STATE AND TERRITORY90 34 drowning deaths ocurred in New South Wales 47 18 drowning deaths occurred in Victoria LOCATION AND ACTIVITYWaterway locations43 people ID: 115360

AUSTRALIAN WATERWAYS Supported by STATE AND TERRITORY90

Share:

Link:

Embed:

Download Presentation from below link

Download Pdf The PPT/PDF document "NATIONAL DROWNING REPORT 2014ROYAL LIFE ..." is the property of its rightful owner. Permission is granted to download and print the materials on this web site for personal, non-commercial use only, and to display it on your personal computer provided you do not modify the materials and that you retain all copyright notices contained in the materials. By downloading content from our website, you accept the terms of this agreement.


Presentation Transcript

NATIONAL DROWNING REPORT 2014ROYAL LIFE SAVING AUSTRALIAN WATERWAYS Supported by STATE AND TERRITORY90 (34%) drowning deaths ocurred in New South Wales 47 (18%) drowning deaths occurred in Victoria LOCATION AND ACTIVITYWaterway locations43 people (16%) were using Watercraft immediately AUSTRALIAN WATERWAYS 215 51 Watch our videos & share to save a life: DROWNING DEATHS IN 2013/14There were 266 drowning deaths in Australian waterways between 1 July 2013 and 30 June 2014. The number of people drowning in Australia has decreased this year and is the lowest number recorded in the past 12 years. This year’s gure of 266 drowning deaths is a reduction of 29 drowning deaths (or 10%) on the adjusted total of 295 drowning deaths in 2012/13. This is a reduction of 26 drowning deaths (or 9%) on the 10 year (2003/04 to 2012/13) average of 292 drowning deaths. The crude drowning rate in 2013/14 is 1.14 per 100,000 population, compared to the 10 year average of 1.37 per 100,000 population (Figure 1). Trends over time: Fatal drowning in AustraliaAustralia 2002/03 to 2013/14, 10 Year Average 1.651.481.391.521.351.331.431.401.261.211.281.141.373229283128228311302822762952662920.000.501.001.502.002.50050100150200250300350 Number of Deaths/100,000 Populaon Number of Deaths / Year CASE STUDY:PROGRESS TOWARDS THE TARGETS OF THEAUSTRALIAN WATER SAFETY STRATEGY 2012-15 The Australian Water Safety Strategy 2012-15 (AWSS 2012-15) continues to focus drowning prevention efforts towards achieving a 50% reduction in drowning by the year 2020. The progress in 2013/14 against the key priority areas of the AWSS 2012-15 is reported below: AWSS 2012-15 Goal AreasDrowning DeathsAWSS 2012-15 Target by 2020ProgressProgress of AWSS 2012-15 Goals and Target ReductionsThe Australian Water Safety Strategy 2012-15 (AWSS 2012-15) can be downloaded from www.watersafety.com.au CASE STUDY: This year, the only age group to record an increase against the 10 year average was the 18 to 24 years age group. A Almost three quarters (71%) occurred in New South Wales and Queenslandyears age groups. We typically see young adults, recreating in unfamiliar aquatic locations, with issues such as risk taking behaviour, peer inuences and alcohol consumption contributing to drowning. Drowning prevention strategies targeting Of the 266 drowning deaths that occurred in Australian waterways in 2013/14, 215 (81%) were male. New South Wales recorded the largest number of drowning deaths in 2013/14 with 90 drowning deaths (or 34% of all drowning deaths in 2013/14). This was followed by Queensland with 60 drowning deaths (23%) and Victoria with 47 drowning deaths (18%). When calculated as rates per 100,000 population, the Northern Territory has the highest rate of drowning in Australia at 5.36 per 100,000 population, almost four times higher than NSW and QLD (1.21 and 1.28 respectively) . The Australian Capital Territory has the lowest rate of drowning in Australia in 2013/14 with a rate of 0.52 (Figure 3). The average age of those who drowned was 41.6 years, with females being on average older than males (47.6 years for females, compared to 40.1 years for males). The 25-34 years age group had the highest number of drowning deaths with 43 (16% of all drowning deaths in 2013/14), followed by the 35-44 and 55-64 years age groups with 36 drowning deaths respectively (Figure 4). The 18-24 years age group was the only age group to record an increase against the 10 year average, with 35 drowning deaths, an increase of 17% on the 10 year average of 30 drowning deaths. All other age groups held steady or recorded reductions against the 10 year average, with the most notable reduction in the 54 years age groups with reductions of 29% and 25% respectively (Figure 4). Drowning Deaths by Sex and State / Territory, 18-24 years age group the only age group to record an Drowning Deaths by Age Group, 10 Year Average, 2013/14 273949128372517411221050.521.215.361.280.831.950.811.18-1.000.001.002.003.00005.006.000102030405060708090100ACTNSWNTQLDSATASVICWA Male Female Number of Deaths / 100,000 populaon 31867304339403627252064535433630362724051015202530354045500-4Years5-9Years10-14Years15-17Years18-24Years25-34Years35-44Years45-54Years55-64Years65-74Years75+Years 10 Year Average 2013/1 The Northern Territory continues to record the highest rate Drowning deaths occur throughout the year, however the largest number occurred in Summer (91 deaths), followed by Spring (65) and Autumn (61) (Figure 5). all drowning deaths in the 2013/14 nancial year. The Fatal drowning in Australia occurs across all seasons Summer 34%Autumn 23%Winter 18%Spring 24% WHEN DO THESE DROWNING DEATHS OCCUR? Highest number of drowning deaths across 2013/14 recorded in the month of February Sunday the most common day of the week for drowning Drowning Deaths by Day of the Week of Incident, The largest number of drowning deaths occurred in the Afternoon Drowning Deaths by Grouped Time of Incident, *Please note: Time of incident was unknown in 27 cases 142012252828293431228150510152025303540 293234294431670102030405060 \r\f \n \t\r\f \n\b \t\r\f\b \n\b \t\r\f\b \n \t The Rivers / Creek / Stream category was the category of aquatic location with the highest number of drowning deaths in 2013/14 with 80 (30%), followed by Swimming Pools (15%) and Beaches (13%) (Figure 9). There were 15 drowning deaths where the location of the incident was coded as ‘Other’ which includes ponds, drains and quarries. WHERE AND HOW DO THESE DROWNING DEATHS OCCUR? Rivers, creeks and streams account for over double the number of drowning deaths of the next closest category Diverse range of activities being undertaken prior to Drowning Deaths by Activity 21342532802039150102030405060708090 \r\f \n\t\b  involving Watercraft accounted for 56 and 43 drowning deaths respectively. Activity immediately prior to CASE STUDY:DROWNING DEATHS AS A RESULT OF SWIMMING AND RECREATING Recreating. As the leading activity prior to drowning death in this year’s National Drowning Report, a detailed analysis of Trends by State and Territory follow population distribution with NSW recording the highest number of drowning medical conditions on the risk of drowning. If you haven’t been in the water in some time, it’s important to start slowly There were 105 drowning deaths in Inland Waterways 84% of the drowning deaths in Inland Waterways this nancial year. Signicant increases against the 10 year average were experienced in the 18-24 years age group and the 25-34 years age group. Drowning deaths in inland waterways in people aged 25-34 years increased by 33% to 20, compared On a State and Territory basis, Victoria experienced or Territory to record an increase again the 10 year drowning in Inland Waterways in 2013/14, with 29 in Inland Waterway drowning deaths as a result of Watercraft (21 deaths, an increase of 31% against the 10 every year. Royal Life Saving urges caution when in, on and around our rivers, creeks and streams. Avoid alcohol, LOCATION IN FOCUS: INLAND WATERWAYS Drowning deaths in Inland Waterways increase in 2013/14 Steep increases against the 10 year average in Inland Waterway drowning deaths in people aged 18-34 years Inland Waterway Drowning Deaths by Age Group, 10 Year Average, 2013/14Victoria records a 50% increase in Inland Waterway drowning deaths in 2013/14 against the 10 year average Inland Waterway Drowning Deaths by State / Territory, 10 Year Average, 2013/1469% increase against 10 year average of Swimming and Recreating Inland Waterway drownings Inland Waterway Drowning Deaths by Activity Immediately Prior, 10 Year Average, 2013/14Inland Waterway Drowning Deaths 2002/03 to 2013/14, 10 Year Average 11991011899010097127103100105102020406080 10 0 12 0 140 643311151314139103422152013131412705 10152025 0-4Years5-9Years10-14Years15-17Years18-24Years25-34Years35-44Years45-54Years55-64Years65-74Years75+Years Inland Waterways 10 Year Average Inland Waterways 2013/14 13652954149135530432165 101520253040 ACTNSWNTQLDSATASVICWA Inland Waterways 10 Year Average Inland Waterways 2013/14 12135172216161182922727211705 101520253035 Inland Waterways 10 Year Average Inland Waterways 2013/14 7 There were 39 drowning deaths in Swimming Pools in 2013/14. This gure is a reduction of 4 drowning deaths (or 9%) on the 10 year average of 43 drowning deaths (Figure 15). Men accounted for 72% of all drowning deaths in Swimming Pools in the 2013/14 nancial year. Children aged under ve, continue to be the age group that accounts for the largest number of drowning deaths in Swimming Pools in Australia, with 14 drowning deaths in 2013/14 or 36% of all drowning deaths in Swimming Pools. The 14 drowning deaths in the 0-4 years age group represents an 18% reduction on the 10 year average of 17 drowning deaths (Figure 16). The largest increase in drowning deaths in Swimming Pools was recorded in the 35-44 years age group with the 5 drowning deaths seen in this age group representing an increase of 150% against the 10 year average of 2 drowning deaths (Figure 16). Falls into water accounted for almost half (49%) of all drowning deaths in Swimming Pools in 2013/14. Swimming and Recreating was the next leading activity prior to drowning in Swimming Pools, accounting for 41% of Swimming Pool drownings in 2013/14 (Figure 17). Reductions against the 10 year average for Swimming Pool drowning deaths were recorded in New South Wales and Queensland, with reduction of 38% and 23% respectively. The Northern Territory and Western Australia both recorded increases in 2013/14 against the 10 year average for their State or Territory. Swimming Pool drowning deaths increased by 200% in the Northern Territory and by 33% in Western Australia (Figure 18). Children under ve continue to account for a large proportion of drowning deaths in swimming pools, particularly home swimming pools. It is important to ensure that home pools are fenced with a correctly installed compliant pool fence with a self-closing and self-latching gate. Never prop the gate open or leave objects that could be climbed on near the fence. Regularly check your pool fence, gate and surrounds as the strength and integrity of the structure can weaken over time and exposure to the elements. LOCATION IN FOCUS: Swimming Pool drowning deaths decline against 10 year average Swimming Pool Drowning Deaths 2002/03 to 2013/14, 10 Year AverageSwimming Pool Drowning Deaths by State / Territory, 10 Year Average, 2013/14 Children under five account for 36% of all Swimming Pool Swimming Pool Drowning Deaths by Age Group, 10Year Average, 2013/1490% of Swimming Pool drownings as a result of Falls into water or Swimming and Recreating Swimming Pool Drowning Deaths by Activity Immediately Prior, 2013/14Reductions in Swimming Pool drowning deaths recorded against 10 Year average in NSW and QLD 475144384246515439224439430 102030405060 1721133242451411325235302468 1012141618 0-4Years5-9Years10-14Years15-17Years18-24Years25-34Years35-44Years45-54Years55-64Years65-74Years75+Year s Swimming Pools 10 Year Average Swimming Pools 2013/14   \r\f \n\t \b\r \t\n \r 11611324610310224802468 1012141618 ACTNSWNTQLDSATASVI CW A Swimming Pools 10 Year Average Swimming Pools 2013/148 There were 34 drowning deaths at Australian Beaches in the 2013/14 nancial year. This gure is a reduction of 16 drowning deaths (or 32%) on the 10 year average of 50 drowning deaths (Figure 19). Men accounted for 82% of all drowning deaths at Beaches. The largest number of drowning deaths at Beaches occurred in the 25-34 years age group with 8 drowning deaths (or 24% of all beach drowning deaths in 2013/14). The age group to record the largest reduction against the 10 year average was the 35-44 years age group. This age group recorded 2 drowning deaths in 2013/14, a reduction of 75% against the 10 year average of 8 drowning deaths. The 75+ years age group was the only age group to record an increase in 2013/14 against the 10 year average, with 4 drowning deaths (Figure 20). Almost every State and Territory recorded reductions New South Wales recorded the highest number of Beach of 21 drowning deaths. Victoria recorded the second Royal Life Saving encourages people to swim at patrolled beaches during patrol times and between the red and yellow ags. Avoid consuming alcohol prior to swimming or recreating at the beach and be aware of the conditions and your own skills and tness. For older Australians it is important to be aware of the role that underlying medical conditions and multiple medications may have on your drowning risk. LOCATION IN FOCUS: Beach Drowning Deaths, 2002/03 to 2013/14, 10 Year Average Beach Drowning Deaths by State / Territory, 10 Year Average, 2013/14 Beach drownings records 32% reduction in 2013/14 against the 10 year average Sharp reductions in Beach drownings in 35-44 and 45-54 Beach Drowning Deaths by Age Group, 10 Year Average 2013/14Over half of all Beach drowning deaths in 2013/14 as a Beach Drowning Deaths by Activity Immediately Prior, 2013/14NT the only location where Beach drownings hold steady against 10 year average 395144555946464835516734500 1020304050607080 1116108784311782362402468 1012 0-4Years5-9Years10-14Years15-17Years18-24Years25-34Years35-44Years45-54Years55-64Years65-74Years75+Year s Beaches 10 Year Average Beaches 2013/14  \r\f \n\t\b\f\f\n 211942761415316405 10152025 ACTNSWNTQLDSATASVI CW A Beaches 10 Year Average Beaches 2013/1 9 Children aged 0-4 yearsThere were 20 children between the ages of 0 and 4 years who drowned in Australia between 1 July 2013 and 30 June 2014. This is a reduction of 11 drowning deaths (or 36%) on both the number of drowning deaths recorded in 2012/13 and the 10 year average. It is pleasing to see a continuation of the downward trend in child drowning deaths in Australia after a spike in drowning deaths Males account for 70% of drowning deaths in the 0-4 years age group in 2013/14. Swimming Pools accounted for 70% of the drowning deaths in this age group, more than 4.5 times that of any other location. All locations for drowning in children 0-4 years recorded reductions in 2013/14 against the 10 year average, most notably a 40% reduction in Falls into water accounted for the vast majority of drowning deaths in children aged 0-4 years, representing the activity being conducted immediately prior to LIFE STAGE IN FOCUS: CHILDREN AGED 0-14 YEARS CASE STUDY:KEEP WATCH ACTIONS FOR PREVENTING CHILD DROWNING Keep Watch is a comprehensive drowning prevention and water safety program for children under ve. The Keep Watch program has four key drowning prevention actions: - Active supervision means focusing all of your attention on your children all of the time, when they are in, on or around the water.Restrict Access - Restricting a child’s access to water can be done by placing a barrier between the child and the water. This can be done with pool fencing by using a Child Safe Play Area.Water Awareness - Water awareness combines a range of strategies including water familiarisation, checking for and removing water hazards and setting rules around water. - Many children are alive today because their parents knew how to perform CPR and responded quickly. www.keepwatch.com.auDrowning Deaths of Children 0-4 Years, 2002/03 to 2013/14, 10 Year AverageDrowning Deaths of Children 0-4 Years by Activity Immediately Prior, 2013/14 Swimming Pools continue to account for majority of drowning Drowning Deaths of Children 0-4 Years by Location, 2013/14, 10 Year AverageFalls into water account for the vast majority of drowning deaths in children aged 0-4 years 4238264237273433252131203105102030354045 531317431214 024681012141618 Bathtub /Spa BathLake / Dam /LagoonOcean /HarbourRiver / Creek/ StreamSwimmingPoolOther 0-4 Years 10 Year Averag 0-4 Years 2013/14 Bathing 15%Falls 8510 CASE STUDY:SWIM AND SURVIVE FUND INITIATIVE To prevent drowning, every child must have basic swimming, are in, on, or around the water. Common barriers to participation The Royal Life Saving Swim and Survive Fund aims to reduce these barriers by providing opportunities for school-aged children experiencing social or economic disadvantage, to learn valuable life skills in water safety, personal survival and basic rescue. www.swimandsurvive.com.au Children aged 5-14 years There were 10 drowning deaths of children aged 5-14 years in Australian waterways between 1 July 2013 and 30 June 2014. The number of drowning deaths in this age group in 2013/14 is a reduction of 4 drowning deaths (or 29%) on the 10 year average of 14 drowning deaths (Figure 26). Males accounted for 60% of the The Lake / Dam / Lagoon category was the aquatic location that recorded the largest number of drowning deaths within this age group, accounting for 40% of the deaths. This was followed by River / Creek / Stream and Beach locations which accounted for 20% of the With respect to activity immediately prior to drowning, in over half of all cases in the 5-14 years age group, the child was in the water, Swimming and Recreating prior to drowning. A further one fth of drownings in this age group were as a result of Falls into water (20%) (Figure 28). 29% reduction in drowning deaths of children 5-14 years in Drowning Deaths of Children 5-14 Years, 2002/03 to 2013/14, 10 Year AverageDrowning Deaths of Children 5-14 Years by Activity Immediately Prior, 2013/14 Inland Waterways account for 60% of drowning deaths in Drowning Deaths of Children 5-14 Years by Swimming and Recreating was the leading cause of 14111611221413151513910140510152025 Beach 20Lake / Dam / Lagoon 40%River / Creek / Stream 20Swimming Pool 10Other 10 \r\f \n\t\b\r\t\n There were 40 drowning deaths of Young People aged between 15 and 24 years in Australia between 1 July 2013 and 30 June 2014. This represents a concerning increase of 12 drowning deaths (or 43%) on the 28 drowning deaths recorded in 2012/13. It also represents an increase of 11% against the 10 year average of 36 drowning deaths (Figure 29). Males accounted for 88% of all drowning deaths in this age group. The River / Creek / Stream category saw the 24 years age group in 2013/14, recording 13 drowning deaths, an increase of 18% on the 10 year average. Reductions against the 10 year average were recorded in the categories of Bathtub / Spa Bath, Beach and Ocean / Harbour Swimming and Recreating was the activity being undertaken immediately prior to drowning in almost half (48%) of all cases. The second most common activity being conducted immediately prior to the drowning deaths occurring in this age group was incidents involving Watercraft (13%) followed by Falls into water (10%). Activity immediately prior to drowning was unknown in 5% of drowning cases in this age group (Figure 31). New South Wales was the State that recorded the highest number of drowning deaths with 17 (or 43% of all drowning deaths in this age group). This was followed by Queensland with 12 drowning deaths (30% of the total) and Victoria with 7 drowning deaths (18% of the total). There have been increases in the number of drowning deaths recorded in this age group against the ten year average across many States and Territories. New South Wales recorded a 31% increase against its 10 year average and Victoria recorded a 40% increase against the 10 year average for this age group (Figure 32). LIFE STAGE IN FOCUS: Drowning Deaths of Young People 15-24 Years, 2002/03 to 2013/14, 10 Year Average18% increase against 10 year average in River / Creek / Stream drownings in 15-24 year olds in 2013/14 Drowning Deaths of Young People 15-24 Years by Location, 10 Year Average, 2013/14 353536373435393835 45 2840360510152025304045 50 2835113411744 13 44302468101214 15-24 Years 10 Year Average 15-24 Years 2013/14 Drowning in 15-24 year olds increases by 11% in 2013/14 against 35 15-24 YEARS 12 Drowning Deaths of Young People 15-24 Years by Activity Immediately Prior, 2013/14Drowning Deaths of 15-24 year olds in NSW increase by 31% on 10 Drowning Deaths of Young People 15-24 Years by State / Territory, 10 Year Average, 2013/14 \r\f \n\t\b\t \f \r ­\t  13111115417212117 026810121416 ACTNSWNTQLDSATASVI CW A 15-24 Years 10 Year Average 15-24 Years 2013/14 Swimming and Recreating accounts for almost half of all drowning 05 15-24 YEARS CASE STUDY: ROYAL LIFE SAVING NATIONAL FATAL DROWNING DATABASEThe Royal Life Saving National Fatal Drowning Database holds valuable information on all unintentional fatal drowning across all aquatic locations around the country. The depth and quality of information gathered, enhances the support Royal Life Saving provides to Government, Coroners and the community in terms of drowning prevention research and policy. Territory Coronial Ofces and other With the inclusion of cases presented in this year’s National Drowning Report, the database now includes 12 nancial years of fatal drowning incidents across all aquatic locations stretching back to 2002/03. The information contained within the database has allowed Royal Life Saving to conduct distinct reports into fatal drowning in children and young people aged 0-19 years, and in Australian rivers, creeks and streams over 10 years. The database also guides Royal Life Saving public awareness and drowning prevention advocacy work into the future. 1 www.royallifesaving.com.auDROWNING DEATHS IN IVERS, TREAMS: 1 & adolescents aged 5-19 years in Australia: Proudly supported by: 1 aged 50 years and over in Australia: DROWNING DEATHS IN OLDER PEOPLE Proudly supported by: 1 NO CHILD TO MISS OUT: Proudly supported by: There were 87 drowning deaths of people aged 55 years and over in Australian waterways between 1 July 2013 and 30 June 2014. This is a reduction of 27 drowning deaths (or 24%) on the 114 drowning deaths recorded in this age group in 2012/13. It is however, a reduction of 2 drowning deaths (or 2%) on the 10 year average of 89 drowning deaths (Figure 33). Males account for 70% of The River / Creek / Stream location was the category of aquatic location that recorded the largest number of drowning deaths in this age group in 2013/14 with 21 drowning deaths (or 24% of all drowning deaths in this age group). This is however, a reduction of 16% on the 10 year average of 25 drowning deaths (Figure 34). There were a diverse range of activities being undertaken immediately prior to drowning in this age group in the 2013/14 nancial year. Falls into water and incidents involving Watercraft are the leading activities prior to drowning in this age group accounting for 22% respectively. Activity immediately prior to drowning was unknown in 18% of cases indicating almost a fth of those aged 55 and over who drowned in 2013/14 were recreating alone when they drowned (Figure 35). On a State and Territory basis, Victoria has recorded a 67% increase in drowning deaths in this age group, with 20 drowning deaths in 2013/14 compared to the 10 year average of 12 drowning deaths. Western Australia also recorded an increase against the 10 year average, with 14 drowning deaths in 2013/14 in this age group, an increase of 40% on the 10 year average of 10 drowning deaths (Figure 36). Drowning deaths in this age group decline on 2012/13 and Drowning Deaths of People Aged 55+ Years, 2002/03 to 2013/14, 10 Year AverageRiver / Creek / Stream locations the leading location for drowning Drowning Deaths of People Aged 55+ Years by Location, 10 Year Average, 2013/14 5168162541148121211215117051015202530 55+ Years 10 Year Average 55+ Years 2013/14 9582878364798799101911148789020406080 10 0 12 0 LIFE STAGE IN FOCUS: 61 55 YEARS AND OVER Falls into water and Watercraft incidents leading activities prior to drowning in those aged 55 and over Drowning Deaths of People Aged 55+ Years by Activity Immediately Prior, 2013/14Drowning Deaths of People Aged 55+ Years by State / Territory, 10 Year Average, 2013/14 \r\f \n\t\b\r\r\b\b\t\b ­\r€ 13521965121012911561201405 10152025303540 ACTNSWNTQLDSATASVICWA 55+ Years 10 Year Average 55+ Years 2013/126 55 YEARS AND OVER CASE STUDY: DROWNING DEATHS IN A 10 YEAR ANALYSIS 10 year review of drowning deaths in Australian rivers, creeks and streams between 2002 and 2012. This report, released in May 2014, found: Rivers accounted for more drowning deaths than any other aquatic location across the same period, being responsible for 735 drowning deaths or 25% of all drowning deaths across the 10 year period. Men accounted for 80% of all drowning deaths in rivers, creeks and streams. Men drowned at a rate 4 times that of women in rivers. Alcohol was involved in 37% of all river drowning deaths, although this likely under represents the true incidence. In 13% of cases the Blood Alcohol Content (BAC) of the victim was equal to or greater than four Almost half (42%) of all river drowning deaths took place in areas deemed to be regional and remote. A concerning 10.3% of all river drowning deaths occurred in areas classied as Very Remote. Drowning in rivers is largely an issue of local people drowning in their local waterways, with 74% of river victims drowning within 100kms of This research has enabled Royal Life Saving to identify the top 10 river drowning black spots across the country. The Murray River was identied as the number one river drowning black spot in the country with 43 deaths, followed by the Brisbane River in Queensland and the Yarra River in Victoria. The remaining top 10 river drowning black spots are: the Swan River (WA), Hawkesbury River (NSW), Murrumbidgee River (NSW), Sandy Creek (QLD), Derwent River (TAS), Katherine River (NT) and rounding out the top ten is the Macquarie River (NSW). For further information or to download a copy of the report visit www.royallifesaving.com.au There were 71 people who drowned who were known to have an underlying medical condition in 2013/14. This represents 27% of all drowning deaths that occurred in the 2013/14 financial year. Of these, 76% were male and almost half (49%) were aged 55 years and over. The most common conditions were cardiac conditions such as ischaemic heart disease and coronary artery disease, recorded in 49% of cases where an underlying medical condition was known to be present. Other commonly occurring underlying medical conditions included epilepsy (14% of cases known to involve an underlying medical condition) and Dementia (6%). An underlying medical condition was deemed to have been contributory to the chain of events that led to the drowning in 61% of cases where an underlying medical condition was known to be present. Royal Life Saving recommends that people aged 55 years and over ups, as well as anyone participating in activities such as scuba diving. Children or adults with a history of epilepsy should always be supervised when in, on, or around the water. or Territory in a postcode that were visiting a different State or Territory when they drowned. change regularly. Where possible prior to entering the water. There were 47 people who drowned who were known to have recorded positive readings for alcohol in their bloodstream at the time they drowned. Almost all (81%) recorded a blood alcohol reading that was equal to or greater than the legal limit for operating watercraft and vehicles in most States and Territories (0.05mg/L). Of those, almost half (49%), recorded a blood alcohol content reading that was four times the legal limit (0.2mg/L) or higher.behaviour. Some medications may person’s risk of drowning. Royal consider the possible side effects interacting with water. Underlying Medical Conditions Visitor Status Drugs & Alcohol Risk factors that increase a person’s chance of drowning can include age, gender, socio-economic status, presence of underlying medical conditions, skill level and agent factors such as the consumption of drugs and alcohol. The following are case studies investigating the frequency of several risk factors in the drowning deaths that occurred in 2013/14. DROWNING RISK FACTORS PEOPLE DROWNED WHO HAD UNDERLYING PEOPLE DROWNED WHO WERE VISITORS TO THE INCIDENT LOCATIONPEOPLE DROWNED WHO RECORDED POSITIVE Just over one quarter (26%) of drowning deaths in Major Cities and Inner Regional areas took place at River / Creek / Stream locations, followed by Beaches and Swimming Pools (14% respectively). The most common activities being conducted immediately prior to drowning in Major Cities and Inner Regional areas were Swimming and Recreating (22% of all drowning deaths in these remoteness classications) and Falls into water (21%). CASE STUDY: DROWNING DEATHS BY REMOTENESS Ten percent of all drowning deaths in 2013/14 occurred in areas deemed Remote or Very Remote. Drowning River / Creek / Stream locations (41%), followed by Ocean Watercraft incidents (19%) and Falls into water (11%). Access to timely medical assistance in Remote and Very InnerRegional 30% Major 38% Outer 22% VeryRemote 6% Remote 4% Information presented in the Royal Life Saving Society – Australia National Drowning Report 2014 has been collected from State and Territory Coronial offices, the National Coronial Information System (NCIS) and media reports. Cases are collated in partnership with Royal Life Saving State and Territory Member Organisations and analysed by Royal Life Saving Society – Australia. from the NCIS, Police and Royal Life Saving State and Territory possible. However, these gures should be considered interim The report contains information on 2013/14 drowning deaths known as of 5th September 2014. All other data is correct as of 1 July 2014, in accordance with Royal Life Saving’s ongoing quality assurance and data checking processes. All cases in the Royal Life Saving National Fatal Drowning Database are checked against the NCIS on a regular basis and gures are updated in drowning reports from year to year as cases close. The 10 year averages were calculated from drowning death data from 2003/04 to 2012/13 inclusive. accordingly. The category of ‘Non-aquatic Transport’ relates to drowning purposes are captured in the ‘Watercraft’ category (e.g. boats, jet Royal Life Saving would like to thank the following people and organisations for their assistance in producing the Royal Life Saving National Drowning Royal Life Saving State and Territory Children and Young People and Child Rick Carter (Jimmy Too Design)Research and Policy, Royal Life Saving Royal Life Saving Society – Australia (2014) Royal Life Saving National 266 AUSTRALIAN WATERWAYS BETWEEN1 JULY 2013 AND 30 JUNE 2014WATERCRAFT INCIDENTS DROWNING LOCATIONS 81%19% FALLS INTO WATER RECREATING HELP MAKE YOUR COMMUNITY FREE FROM DROWNING 230146090471013 FOR MORE INFORMATION ABOUT THIS REPORT CONTACT:www.royallifesaving.com.auCONTACT ROYAL LIFE SAVINGIN YOUR STATE OR TERRITORY:act@rlssa.org.au nsw@royalnsw.com.au nt@rlssa.org.au TAStas@rlssa.org.au mail@lifesavingvictoria.com.au WA info@rlsswa.com.au facebook.com/RoyalLifeSaving twitter.com/royallifesavingyoutube.com/RoyalLifeSavingAust www.royallifesaving.com.au Supported by