/
near Convective System Mesovorticies and near Convective System Mesovorticies and

near Convective System Mesovorticies and - PDF document

yoshiko-marsland
yoshiko-marsland . @yoshiko-marsland
Follow
415 views
Uploaded On 2016-05-23

near Convective System Mesovorticies and - PPT Presentation

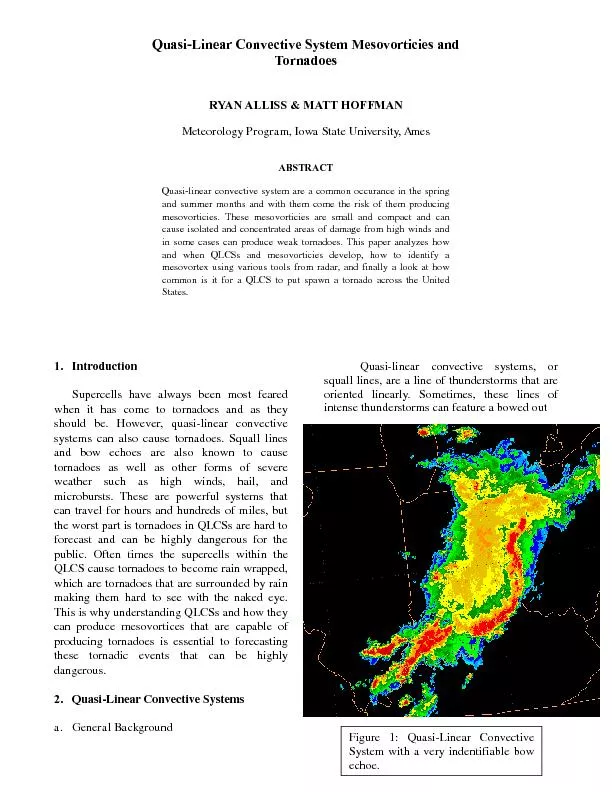
Quasi Li Tornadoes RYAN ALLISS MATT H OFFMAN Meteorology Program Iowa State University Ames ABSTRACT Quasi linear convective system are a common occurance in the spring and summer months and ID: 331042

Quasi - Li Tornadoes RYAN ALLISS MATT H OFFMAN Meteorology

Share:

Link:

Embed:

Download Presentation from below link

Download Pdf The PPT/PDF document "near Convective System Mesovorticies and" is the property of its rightful owner. Permission is granted to download and print the materials on this web site for personal, non-commercial use only, and to display it on your personal computer provided you do not modify the materials and that you retain all copyright notices contained in the materials. By downloading content from our website, you accept the terms of this agreement.


Presentation Transcript

Quasi - Li near Convective System Mesovorticies and Tornadoes RYAN ALLISS & MATT H OFFMAN Meteorology Program, Iowa State University, Ames ABSTRACT Quasi - linear convective system are a common occurance in the spring and summer months and with them come the risk of them producing mesovorticies. These mesovorticies are small and compact and can cause isolated and concentrated areas of damage from high winds and in s ome cases can produce weak tornadoes. This paper analyzes how and when QLCSs and mesovorticies develop, how to identify a mesovortex using various tools from radar, and finally a look at how common is it for a QLCS to put spawn a tornado across the United States. 1. Introduction Supercells have always been most feared when it has come to tornadoes and as they should be. However, quasi - linear convective systems can also cause tornadoes. Squall lines and bow echoes are also known to cause tornadoes as well as other forms of severe weather such as high winds, hail, and microbursts. These are powerful systems that can travel for hours and hundreds of miles, but the worst part is tornadoes in QLCSs are hard to forecast and can be highly dangerous for the public. Often times the s upercells within the QLCS cause tornado es to become rain wrapped, which are tornadoes that are surrounded by rain making them hard to see with the naked eye. This is why understanding QLCSs and how they can produce mesovortices that are ca pable of producing tornadoes is essential to forecasting these tornadic events that can be highly dangerous. 2. Quasi - Linear Convective Systems a. General Background Quasi - linear convective systems, or squall lines, are a line of thunderstorms that are oriented linearly . Sometimes, these lines of intense thunderstorms can feature a bowed out Figure 1: Quasi - Linear Convective System with a very indentifiable bow echoe. center that races ahead of the main li ne. This is known as a bow echoe . Bow ech oes are formed due to a strong rush of flow into the backside of the squall line, which will give the squall line a bowed shape making it a bow echo. The time series of a bow echoe can be seen in figure 2. These storms often can produce damaging hail as well as severe straight line winds. Along with the risk of hail and straight line winds, there is also the risk of tornadoes with both squall lines and bow echoes. They occur primarily in the spring and especially summer months. An example of a typical QLCS and bow echo on radar reflectivity can be seen in figure 1 . b. Atmospheric Process The deve lopment of the QLCS is dependent on the storm produced cold pool and the environmental shear. Once these two components can find a balance then th e QLCS becomes a machine that can go great distances , producing severe weather including even tornadoes . Both the motion of the cold pool and the environmental shear cause horizontal vorticity, which can help in the production of tornadoe s associated with QLCSs. The main contributer is their interactions may cause a powerful updraft as the cold pool advances. The cold pool has colder, denser rain cooled air and cuts into the warm air out ahead that is spinning horizontally due to the shea r. This causes the air just ahead of the cold pool to be forced upward producing convection and sustaining the storm system. This process is most efficient when the horizontal voritcity of the cold pool versus the enivornmental shear is the same because it leads to the strongest updrafts to power the storm (Louisville NWS) . Once a QLCS develops it can become a bow echo e if a portion of the storm accelerates ahead causing a bowed appearance on radar reflectivity. That signature represe nts very strong winds that often cause straight line winds from the rear inflow j et . The rear inflow jet is a feature that can separate a damaging mesovortex that can produce a tornado f rom non - threatening mesovortices . c. QLCS Forecasting 1) SUMMER These QLCSs usually occur during the summer months along a generally east to west oriented frontal boundary with very strong convergence and substantial dew points along the front with the highest values being jus t to the south of the front, which is commonly a warm or stationary f ront. The QLCSs will normally follow a path that is parallel to the front with a gradual and slight component into the warm sector of the boundary (Louisville NWS) . In the upper levels, development is enhanced by straight or anticyclonically curved mid or upperlevel flow near the axis of the ridge was as well as a weak shortwave trough near the region where the QLCS develops. Strong warm air advection at 850mb and 700mb are also helpful in the area where a QLCS may develop. Very high moisture at 850mb is a ccumulated to the south of the eventual track of the bow echo with drier air at 700mb, which helps with enhancing damaging straight line wind potential (Louisville NWS) . QLCS development also depends on unstable airmasses with convective available potenti al energy (CAPE) values in the area of Figure 2: Typical lifecycle of a bow echo from http://www.wrh.noaa.gov/images/ggw/severe/ july13/bowfujit.gif formation on average of 2400 J/kg. Wind shear is a large component of QLCS development with moderate to strong speed shear parallel to the storm track as well some directional shear with veering of the 850 mb and 700m b winds (Louisville NWS) . 2) SPRING In the s pring time the conditions that favor QLCS development change somewhat. At the surface, development is dependent on strong low pressure systems and form in the warm sector ahead of the cold front or along or just to the north of the warm front. At upper levels winds are much more potent than in the summer case with moderate or strong winds throughout the atmosphere with even 30 - 60 kts at 850mb. There is also significant diveregence and convergence fields that lead to strong lift to overcome a lack of moisture or instability. CAPE values are between 500 - 2000 J/kg and there is usually a layer of dry or even cool air in mid - levels that can be entrained into the squall line to increase damaging wind potential. Directi onal shear isn’t as prevelant in the spring cases, but speed shear is very strong with shear for bow echoes being 50 kts within the lowest 2.5km of the atmosphere and minimal shear aloft. 3. Mesovortices Along the bowed out segements of the QLCS, mesovortices often form on the northern side of the bow and usually rotate cyclonically. Mesovorticies are compact couplets of quickly spinning air with very high vertical vorticity. It does appear that mesovorticies and their wind potential can cause more concentrated and intense damage than the straight line winds at the apex of the bow due to the rear inflow jet. These mesovorticies do produce strong winds, but can also produce brief tornadoes that are commonly fairly weak with respect to the damaging st raight line winds mesovorticies can cause (Weisman & Trapp, 2003) . Mesovorticies differ from mesocyclones in that they are low level storm features within 1 km from the surface. Meanwhile, mesocylones are more common at mid levels, but sometimes they can occur at low levels. Because of this, mesovorticies tend to build upwards while mesocyclones build downward. Mesocyclones are more associated with isolated supercell thunderstorms while mesovorticies are associated with squall lines and bow echoes. Their p lacement in relation to the storm is also different with mesovorticies forming along the leading edge of the QLCS near the downdraft region. Mesocyclones form on the backside of the storm in the updraft region (Weisman & Trapp, 2003) . 4. Mesovortex genesis Three main likely contributors have been investigated pertaining to mesovortex generation. These include cyclonic - anticyclonic couplets formed in a late convective cell and as a quasi - linear convective system is beginning to organize, cyclonic - only vortic ies that tend to form during the mature stage of a bow echo, and a possible mechanism from shearing instability. Each process will now be reviewed in detail. a. Cyclonic - anticyclonic couplets As the gust front from the QLCS begins to propagate ahead of th e main system , bulges in the gust front have been observed. This bulge produces cyclonic rotation to the north and ant i - cyclonic rotation to the south with a vertical orientation . First, some local maxima in the convective downdraft is produced forcing t he air in that region to move quicker and out ahead of the neighboring parcels. This creates the bulge along the main outflow. Meanwhile because of baroclinicity across the gust front itself horizontal vorticity is produced from the solenoidal term in the horizontal vorticity equation. Some form of tilting is introduced, either by the updraft or the downdraft. Trapp and Weisman found in their idealized simulation in 2003 that the tilting was due to the updraft. Once some component of the vortex lines have b een tilted into the vertical a smaller scale updraft maxima stretches the column, intensifies the vertical vorticty and creates the mesovorticie. This occurs on both north and south sides of the bulge producing a cyclonically rotating member to the north a nd anti - cyclonically rotating member to the south. This seems to be consistent with observations as the most destructive mesovorticies in the northern hemisphere have been found north of the apex of a bowing segment. The apex can be thought of as the bulg e in the generalized case. b. Cyclonic Only Vorticies Mesovorticies are many times noted on radar during the mature stage of a bow echo. They tend to be cyclonic and have strong rotational shear associated with them. The anticylonic member as described in a), however, is not observed. In the mature stage of a bow echo the rear inflow jet may reach near or even to the surface. Once this happens bulges along the line occur and may interact with the incoming warmer air out ahead of the system. Atkins and La urent in 2008 simulated this scenario and found that this produces cyclonic only mesovorticies just north of the bulge. As for the mechanism, everything is the same from a) except that the air creating the bulge in this case originates from the rear inflow jet rather than from a local downdr aft from a specific cell. T hese mechanisms are much like what has previously been described as the mechanism for supercell tornadoes. c. Shearing Instability Shearing instability has been used many times as an argumen t for genesis for any small scale rotational feature. According to both Trapp and Weisman in 2003 and Atkins Laurent in 2008 shearing instability is not playing a role in mesovortex generation. Both groups have found through all their cases that you can classify the genesis of the mesovorticies into either a) or b) and no evidence has been found that shearing instability is playing any kind of role in mesovortex generation. 5. Favored Environmental Conditions Bow echoes need strong vertical wind shear in order to be produced. The same can be said for mesovorticies. An idealized simulation by Weisman and Trapp in 2003 found t hat strong vertical wind shear in the lowest 2.5 - 5km layer favors the development of mesovorticies. The simulations ran by Weisman and Trapp used different levels of vertical wind shear. They analyzed different magnitudes starting at 10 m/s in increments of 5 m/s up to 30 m/s. Within each increment they also changed the effect of the corilios force by either removing it or changing its overall magnitude. They found that the threshold favorable for the formation of mesovortices was about 20 m/s. With incre asing shear up to 30 m/s the system itself became more organized and produced stronger and longer lived circulations to the north of the apex near the surface. Vertical shear values above 30 m/s tended to lead to supercell storms which were not applicable to their study. Coriolis forcing was also varied in their simulations to see if this was necessary for formation of mesovorticies. The simulations showed that corilios forcing was needed for generation. Without the corilois convective lines had little or no rotation in the idealize d simulations. As soon as the term was set to a normal value with vertical wind shear values of around 20 m/s over the 2.5 km AGL range , mesovorticies were observed. Simple implication s is the closer poleward you are the greate r the chance of having mesovorticies as the coriolios term will be greater. This, however, will have a very small effect on the grand scheme of things as vortex genesis is mainly contributed to the bow echo structure and dynamics within. The use of storm relative helicity has been a widely accepted technique in forecasting supercell mesocyclone potential. Weisman and Trapp warn forecasters not to use this parameter for mesovorticies as storm relative helicity is based off of advection of streamwise horizon tal vorticty. Mesovorticies take advantage of advection of crosswise vorticity during their formation meaning that storm relative helicity will not be applicable. Instability is also a needed factor for any type of strong convection. Bow echoes require at least 1500 J/kg of CAPE in order to be strong. Even though a direct study of mesovorticies to CAPE has yet to be done, the simulations done by Weisman and Trapp used values of CAPE of approximately around 2200 J/kg. This was determined based on a “typical ” warm season mesovortice case. This value led to significant mesovorticies especially as the vertical wind shear increased over 20 m/s. In conclusion, environmental conditions favorable for mesovortices are vertical wind shear over the lowest 2.5 - 5km abo ve ground level layer, positive corilios forcing, and moderate instability. These circulations are most sensitive to increasing vertical wind shear as strong circulations were noted between 20 m/s and 30 m/s of vertical wind shear. 6. Radar Signatures Unl ike supercell thunderstorms, identifying mesovorticies can be very difficult due to their small size and usual low rotational magnitudes on Doppler radar. The use of the stor m relative velocity, reflectivity , and spectrum width prodcuts are useful to ident ify mesovortex signatures. a. Reflectivity Figure 3 - KDVN reflectivity of derecho showing two mesovortices with two inflow notches and rear inflow jet notches As described by Atkins and Nolan mesovorticies tend to form to the north of the apex and along the bowing segment of a quasi linear convective system. Also inflow notches have been observed where the vortex is located due to localized increase in the updraft. The rear inflow jet also, when roughly collocated with these inflow notches, tends to lead to mesovorticies. Rear inflow jets can be observed on reflectivity as a large notch on the bac k side of the bow. The given radar imagery is from a derecho event on June 29, 1998 over eastern Iowa. In figure 3 i t is noted that both the inflow notches and rear inflow notches are along a line that is perpendicular to the main line of storms. Based on the theory of genesis this should worry any forecaster as tilting and stretching of the horizontal vorticity is most likely occurring right along the lin e. In order to verify this notion , storm relative velocity imagery must be checked. b. Storm Relative Velocity Storm relative velocity is a good tool to see rotational features within convection and is widely used as a tool for observing tornadic signatures in s upercell storms. The same technique may be used for mesovorticies. Primary differences from supercell mesocylones signatures are the rotation tends to be on a smaller scale, rotation starts near the surface and builds up with time, and the rotational magni tudes tend be weaker than those of mesocyclones. Look on the lowest tilt for small scale rotational features in the favored locations for mesovorticies. Figure 4 - Two rotational features noted by white circles, collocated with inflow notches from reflec tivity image c. Spectrum Width An underused radar product, spectrum width, is a good tool at identifying mesovorticies. Spectrum width tells a radar operator how turbulent a certain pixel is. Areas of strong rotation tend to have large spectrum widths and seem to work well with tornado observations. Spectrum width should be used as a confirmation that a threat exists after looking at the reflectivity and storm relative velocity images. Figure 1 - Spectrum width showing maximum values collocated with SRM and Ref lectivity signatures Our example shows all three products with signatures that would indicate to a radar operator that strong low - level circulations are present on the bow echo. A brief tornado touchdown was reported in Iowa City, IA which is just to the SE of the circulation just north of the apex of the bow . Many more mesovorticies were produced in this particular case as the bow echo e progressed to the SE into western Illinois. One important thing to note is that since mesovorticies build up from the surface with height , identifying them on radar may take some time after their initial generation. This poses a great threat to those who are near these vorticies near generation time as signatures and therefore warnings will most likely not exist. 7. Torn ado Climatology Based on a study done by Robert Trapp of a total of 3828 tornadoes collected in a database over a three year time period , 79% of the tornadoes were produced by super cells while 18% were produced from QLCS. The results were fairly consistent from year to year. Althought it does appear that 18% doesn’t seem that much over all, 693 tornadoes over three years were produced by QLCSs, which is quite impressive (Trapp et al., 2005) . QLCSs are most prevelant in an area from the lower M ississippi River Valley and up into the Ohio River Valley all the way into Pennsylvania. When considering tornado days, the national average was 25%, so for the three year period 25% of days with a tornado were caused by tornadoes produced form QLCSs. Examning figure 5 , we can see that Indiana saw 50% for precent of tornado day s being Figure 5 : Geopgraphical distribution of ( a) all tornado days, (b) all tornado days due to supercells, and (c) the percentage of all tornado days due to QLCS, for 1998 - 2000. caused by QLCSs. It is interes ting to see that tornado days are much lower when comparing to tornado es from super cells in Texas and Florida. Even considering tornado alley shows much lower percentages of tornado days due to QLCSs (Trapp et al., 200 5) . When looking at the tornadoes and where they fell on the F - scale, tornadoes that were produced by QLCSs are on average much weaker than tornadoes produced by supercells. We see this by looking at Figure 6 . There are no cases of F - 5 tornadoes being produced by QLCSs, and there are really only around a dozen that are F - 3 or F - 4 intensity when produced by QLCSs. In Figure 6 , the QLCS distribution is shifted or normalized so that the F - 2 tornadoes that are produced from QLCSs have the same value of 237 tornadoes as does the distribution for supercell produced tornadoes . When this is done, it can be seen that the QLCSs account for more F - 1 tornadoes than do supercell tornadoes. Actually, there is a much higher probability , given a QLCS, of a weak tornado than for supercells (T rapp et al., 2005) . The occurance of QLCS tornadoes are more probable than supercell tornadoes during the cool season of January through March. QLCS tornadoes are most frequent in nature , however , like supercell tornadoes during the months of April throu gh June (Trapp et al., 2005) . When considering time of occurance, QLCS tornadoes had a clear high point of occurance at 18 LST. However, compared to supercell tornadoes, QLCS tornadoes are more likely to occur during the late night or early morning hours (Trapp et al., 2005) . 8. Conlusions QLCS often do produce mesovorticies that can cause great damage to property and unfortunately take lives. QLCSs also can for m those mesovorticies that produce tornadoes along with large hail and extremely high winds. Q LCS occur in the warm months of the spring and summer and thrive on warm moist air and can be produced by large synoptic storm systems or even just slow moving warm fronts or stationary fronts with relatively weak upper level forcing. Mesovorticies are is olated couplets of very quickly moving air with v ery high values of vertical vor ticity. Their genesis occurs from Figure 6 : U.S. tornado distribution by F scale and parent storm type (supercell, QLCS, other), present (a) with all tornadoes and (b) with the distribution of QLCSs adjusted or normalized such that it has 237 F2 tornadoes. cyclonic - anticyclonic couplets that form on either side of the bulge associated with a bow echo. These mesovorticies now have a column of a la rge value of vertical vorticity. Another method is from cyclonic only mesovorticies that can be created during the mature state of a bow echo, and the final method is shearing instability, which is of less confidence in creating mesovorticies. There are many environmental conditions that need to be met to produce these mesovorticies with one of the most important being strong vertical wind shear. Also, the further north you go the more coriolis forcing you have, which has been shown to help create mesovor ticies. You also do need moderate values of instability and CAPE to produce mesovorticies. Mesovorticies are many times very small features, and they can be hard to distinguish using radar. Unlike super cells, it is very rare to see any sort of hook shape associated with mesovorticies within squall lines on base reflectivity. Base reflectivity can be used to spot inflow notches that can be signs of rotation and mesovorticies. Storm relative velocity is key in helping to identify areas of rotation within t he QLCS. Mesovorticies on storm relative velocity tend to be smaller and weaker. For spectru m width, mesovorticies will tend to have higher overall values than surrounding areas . Using all three of these tools can help identify mesovortex locations within a QLCS. It is still tough to judge whether one is capable of prod ucing a tornado due to the weak and small signatures compared to mesocyclones. Tornadoes associated with QLCSs are less common accounting for about 18 - 20% on a given year. QLCS tornadoes are more common in the Mississipi river valley up ino the Ohio river valley areas. More often than not QLCSs are responsible for spawning weaker torndoes, especially, F - 1 tornadoes. 9. References Atkins, N.T., and M. St. Laurent, 2009: Bow Echo Mesovortices. Part II: Their Genesis. Mon. Wea. Rev. , 137 , 1514 – 1532. Davis, C., N. Atkins, D. Bartels, L. Bosart, M. Coniglio, G. Bryan, W. Cotton, D. Dowell, B. Jewett, R. Johns, D. Jorgensen, J. Knievel, K. Knupp, W.C. Lee, G. Mcfarquhar, J. Moore, R. Przybylinski , R. Rauber, B. Smull, R. Trapp, S. Trier, R. Wakimoto, M. Weisman, and C. Ziegler, 2004: The Bow Echo and MCV Experiment: Observations and Opportunities. Bull. Amer. Meteor. Soc. , 85 , 1075 – 1093. Weisman, M.L., and C.A. Davis, 1998: Mechanisms for the Gen eration of Mesoscale Vortices within Quasi - Linear Convective Systems. J. Atmos. Sci. , 55 , 2603 – 2622. Weisman, M.L., and R.J. Trapp, 2003: Low - Level Mesovortices within Squall Lines and Bow Echoes. Part I: Overview and Dependence on Environmental Shear. Mo n. Wea. Rev. , 131 , 2779 – 2803. Trapp, R.J., and M.L. Weisman, 2003: Low - Level Mesovortices within Squall Lines and Bow Echoes. Part II: Their Genesis and Implications. Mon. Wea. Rev. , 131 , 2804 – 2823. Atkins, N.T., and M. St. Laurent, 2009: Bow Echo Mesovo rtices. Part I: Processes That Influence Their Damaging Potential. Mon. Wea. Rev. , 137 , 1497 – 1513. Trapp, R.J., S. A. Tessendorf, E.S. Godfrey, and H.E. Brooks, 2005: Tornadoes from Squall Lines and Bow Echoes. Part I: Climatological Distributions. Wea Forecasting , 131 , 2779 - 2803. http://www.crh.noaa.gov/lmk/?n=squall/bow http://www.crh.noaa.gov/lsx/?n=06_29_98part2 http://www.crh.noaa.gov/lsx/?n=My2404QLCS http://services.trb.com/wgn/torna do/izzi - 2007%20Lower%20Great%20Lakes%20Derecho.pd f http://www.mmm.ucar.edu/wrf/users/workshops/WS 2005/abstracts/Session11/2 - Atkins.pdf http://davieswx.blogspot.com/2008/05/bow - echo - tornadoes - in - kansas - city - 5208.html https://www.meted.ucar.edu/loginForm.php?urlPath =mesoprim/severe2 http://www.erh.noaa.gov/gsp/localdat/cases/Bessem erCityTornado/BessemerCityTornado.html http://www.crh.noaa.gov/lsx/science/bamex/bamex.p hp http://ams.confex.com/ams/23SLS/techprogram/pap er_115155.htm