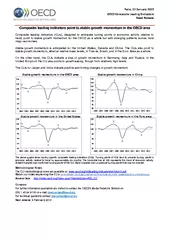
/
OECD Composite Leading Indicators: OECD Composite Leading Indicators:

OECD Composite Leading Indicators: - PDF document

yoshiko-marsland
yoshiko-marsland . @yoshiko-marsland
Follow
408 views
Uploaded On 2015-08-23

OECD Composite Leading Indicators: - PPT Presentation

Turning Points of Reference Series and Component Series OECD Countries Australia Austria Belgium Canada Chile Czech Republic Denmark Estonia Finland France Germany Greece Hungary Ireland Israel Italy ID: 114095

Turning Points Reference Series

Share:

Link:

Embed:

Download Presentation from below link

Download Pdf The PPT/PDF document "OECD Composite Leading Indicators:" is the property of its rightful owner. Permission is granted to download and print the materials on this web site for personal, non-commercial use only, and to display it on your personal computer provided you do not modify the materials and that you retain all copyright notices contained in the materials. By downloading content from our website, you accept the terms of this agreement.


Presentation Transcript

OECD Composite Leading Indicators: Turning Points of Reference Series and Component Series OECD Countries Australia Austria Belgium Canada Chile Czech Republic Denmark Estonia Finland France Germany Greece Hungary Iceland Ireland Israel Italy Japan Korea Latvia Lithuania Luxembourg Mexico Netherlands New Zealand Norway Poland Portugal Slovak R epublic Slovenia Spain Sweden Switzerland Turkey United K ingdom United States Non - member economies Area Brazil China India Indonesia Russian Federation South Africa OECD Total OECD + non - member economies Major seven countries OECD Europe Euro area Four big European countries NAFTA Major five Asia countries Febr uary 20 20 OECD Composite Leading Indicators http://www.oecd.org/std/leading - indicators/ 2 Australia Component Series (Unit) Source Permits issued for dwellings sa (number) Manufacturing - Orders inflow: tendency sa (% balance) Manufacturing - Production: tendency sa (% balance) Manufacturing - Employment: tendency sa (% balance) S hare price s: S&P/ASX 200 index ( 2015=100 ) Terms of trade Yield 10 - year commonwealth government bonds (% p . a . ) inverted Australian Bureau of Statistics (ABS) ACCI Westpack ACCI Westpack ACCI Westpack Reserv e Bank of Australia Australian Bureau of Statistics (ABS) Reserve Bank of Australia Reference chronology of turning points Trough 1961M10, Peak 1965M2, Trough 1966M4, Peak 1970M4, Trough 1972M9, Peak 1973M11, Trough 1975M10, Peak 1976M8, Trough 1978M2, Peak 1981M8, Trough 1983M4, Peak 1985M7, Trough 1986M8, Peak 1989M7, Trough 1992M1, Peak 1994M7, Trough 1996M11, Peak 1999M12, Trough 2001M2, Peak 2002M6, Trough 2003M4, Peak 2008M2, Trough 2011M2, Peak 2012M5, Trough 2015M5, Peak 2018M4 OECD Composite Leading Indicators http://www.oecd.org/std/leading - indicators/ 3 Austria Component Series (Unit) Source Manufacturing - Production: future tendency sa (% balance) Manufacturing - Order books: level sa (% balance) Manufacturing - Business situation of Germany: present sa (normal=100) Consumer - Confidence indicator sa (% balance) Job vacancies: unfilled sa (persons) Spread of interest rates (% p . a . ) European Commission European Commission I FO Institute, Germany European Commission European Commission European Central Bank Reference chronology of turning points Peak 1961M3, Trough 1963M1, Peak 1966M3, Trough 1967M11, Peak 1970M9, Trough 1971M11, Peak 1974M2, Trough 1975M6, Peak 1977M8, Trough 1978M5, Peak 1980M1, Trough 1981M10, Peak 1983M9, Trough 1984M6, Peak 1986M5, T rough 1987M2, Peak 1991M10, Trough 1993M4, Peak 1995M3, Trough 1997M4, Peak 2000M9, Trough 2003M9, Peak 2008M2, Trough 2009M7, Peak 2012M2, Trough 2015M3, Peak 2018M2 OECD Composite Leading Indicators http://www.oecd.org/std/leading - indicators/ 4 Belgium Component Series (Unit) Source P assenger car registrations sa (number) Manufacturing - Employment: future tendency sa (% balance) Manufacturing - Export orders inflow: tendency sa (% balance) Manufacturing - Demand: future tendency sa (% balance) Manufacturing - Production: tendency sa (% balance) Consumer - Confidence indica tor sa (% balance) European Automobile Manufacturers' Association European Commission National Bank of Belgium National Bank of Belgium European Commission European Commission Reference chronology of turning points Trough 1961M5, Peak 1962M5, Trough 1963M5, Peak 1964M8, Trough 1968M6, Peak 1970M6, Trough 1971M9, Peak 1974M4, Trough 1975M7, Peak 1976M7, Trough 1977M8, Peak 1980M3, Trough 1983M4, Peak 1984M2, Trough 1987M2, Peak 1990M2, Trough 1993M4, Peak 1994M12, Trough 1996M7, Peak 1997M9, Trough 19 98M11, Peak 2000M10, Trough 2003M8, Peak 2008M1, Trough 2009M4, Peak 2011M9, Trough 2013M4, Peak 2017M3, Trough 2019M7 OECD Composite Leading Indicators http://www.oecd.org/std/leading - indicators/ 5 Canada Component Series (Unit) Source Deflated Monetary aggregate M1 sa ( 2010 cad) Manufacturing - Industrial confidence indicator (USA - PMI) sa Consumer - Confidence indicator ( 2015=100 ) Spread of interest rates (% p. a.) Ratio of inventories to shipments inverted Share prices: S&P/TSX composite index ( 2015=100 ) Statistics Canada Institute of Supply Management USA Conference Board Canada Statistics Canada Statistics Canada Statistics Canada Reference chronology of turning points Peak 1962M2, Trough 1963M6, Peak 1966M4, Trough 1967M12, Peak 1968M12, Trough 1971M2, Peak 1974M1, Trough 1975M4, Peak 1976M6, Trough 1977M7, Peak 1981M5, Trough 1982M11, Peak 1985M11, Trough 1986M11, Peak 1989M5, Trough 1992M5, Peak 1994M12, Trough 1996M8, Peak 2000M6, Trough 2001M10, Peak 2002M7, Trough 2003M10, Peak 2007M8, Trough 2009M7, Peak 2011M1 1, Trough 2012M11, Peak 2014M9, Trough 2016M6, Peak 2017M8, Trough 2019M2 OECD Composite Leading Indicators http://www.oecd.org/std/leading - indicators/ 6 Chile Component Series (Unit) Source Production in total mining sa index ( 2015=100 ) Retail trade - Confidence indicator sa (% balance) Manufacturing - Production: tendency sa (% balance) Monetary aggregate M1 sa (CLP) Share prices: IPSA index ( 2015=100 ) I I TS Net trade (f.o.b. - c.i.f.) sa (CLP) National Statistical Institute of Chile ICARE ICARE Central Bank of Chile Santiago Stock Exchange Central Bank of Chile Reference chronology of turning points Peak 1997M12, Trough 1999M4, Peak 2001M2, Trough 2003M10, Peak 2008M3, Trough 2009M8, Peak 2013M7, Trough 2017M3, Peak 2018M4 OECD Composite Leading Indicators http://www.oecd.org/std/leading - indicators/ 7 Czech Republic Component Series (Unit) Source BOP Capital account, debit (czk) Services - Demand evolution: future tendency sa (% balance) Manufacturing - Production: tendency sa (%) CPI HICP All items ( 2015=100 ) inverted Consumer - Confidence indicator sa (% balance) ITS Exports f.o.b. total sa (czk) Share prices: PX - 50 index ( 2015=100 ) Czech National Bank European Commission European Commission Czech Statistical Office European Commission Czech Statistical Office Czech Statistical Office Reference chronology of turning points Peak 1996M8, Trough 1999M3, Peak 2000M11, Trough 2004M4, Peak 2008M4, Trough 2009M7, Peak 2011M5, Trough 2013M6, Peak 2015M9, Trough 2016M9 OECD Composite Leading Indicators http://www.oecd.org/std/leading - indicators/ 8 Denmark Component Series (Unit) Source Total retail trade (Volume) sa ( 2015=100 ) P assenger car registrations sa (number) Manufacturing - Employment: future tendency sa (% balance) Manufacturing - Production: future tendency sa (% balance) Central bank off i ci al discount rate (% per annum) inverted Deflated monetary aggregate M1 (dkk) ITS Mineral fuels, lubricants and related materials exports deflated CPI energy sa (dkk) Consumer - Confidence indicator sa (% balance) Statistics Denmark Statistics Denmark European Commission European Commission National Bank of Denmark National Bank of Denmark Statistics Denmark European Commission Reference chronology of turning points Trough 1960M8, Peak 1962M3, Trough 1963M6, Peak 1964M11, Trough 1968M3, Peak 1969M7, Trough 1971M3, Peak 1973M4, Trough 1975M5, Peak 1976M9, Trough 1978M3, Peak 1979M12, Trough 1981M9, Peak 1986M1, Trough 1987M2, Peak 1989M1, Trough 1991M1, Peak 1992M9, Trough 1993M7, Peak 1994M12, Trough 1995M12, Peak 1997M5, Trough 1998M5, Peak 2000M8, Trough 2003M7, Peak 2006M7, Trough 2009M7, Peak 2011M4, Trough 2014M4, Peak 2016M12, Trough 2017M10 OECD Composite Leading Indicators http://www.oecd.org/std/leading - indicators/ 9 Estonia Component Series (Unit) Source Manufacturing - Export order books: level sa (% balance) Total retail trade (Value) sa ( 2015=100 ) Passenger car registrations sa ( 2015=100 ) CPI Food excl. Restaurants ( 2015=100 ) inverted Share prices: OMX Tallin index ( 2015=100 ) ITS Net trade (f.o.b. - c.i.f.) sa (Eur) European Commission Eurostat European Automobile Manufacturers' Association Statistics Estonia NASDAQ OMX Baltic Eurostat Reference chronology of turning points Trough 1996M2, Peak 1997M12, Trough 1999M7, Peak 2000M7, Trough 2002M12, Peak 2007M5, Trough 2009M9, Peak 2012M11, Trough 2016M6, Peak 2018M11 OECD Composite Leading Indicators http://www.oecd.org/std/leading - indicators/ 10 Finland Component Series (Unit) Source CPI All items ( 2015=100 ) inverted Consumer - Confidence indicator sa (% balance) Spread of interest rates (% p.a. ) Manufacturing - Production: tendency sa (% balance) Domestic PPI Industrial activities ( 2015=100 ) Manufacturing - Finished goods stocks: level sa (% balance) inverted Share prices : OMXH index ( 2015=100 ) Services – Demand evolution: future te ndency (% balance) Statistics Finland European Commission European Central Bank European Commission Statistics Finland European Commission Bank of Finland European Commission Reference chronology of turning points Peak 1961M11, Trough 1963M3, Peak 1965M6, Trough 1968M7, Peak 1970M7, Trough 1971M10, Peak 1973M11, Trough 1978M1, Peak 1980M8, Trough 1982M2, Peak 1982M11, Trough 1984M7, Peak 1985M4, Trough 1987M2, Peak 1990M1, Trough 1993M2, Peak 1995M5, Trough 1996M6, Peak 1998M11, Trough 1999M8, Peak 2000M11, Trough 2003M3, Peak 2004M11, Trough 2005M8, Peak 2008M1, Trough 2009M7, Peak 2011M11, Trough 2015M3, Peak 2018M1, Trough 2019M1 OECD Composite Leading Indicators http://www.oecd.org/std/leading - indicators/ 11 France Component Series (Unit) Source Passenger car registrations sa (number) Consumer - Confidence indicator sa (% balance) Manufacturing - Production: future tendency sa (% balance) Share prices: CAC All - tradable index ( 2015=100 ) CPI HICP All items ( 2015=100 ) inverted Manufacturing - Export order books: level sa (% balance) Construction - Selling prices: future te ndency sa (% balance) Permits issued for dwellings sa ( 2015=100 ) INSEE European Commission European Commission Bank of France Eurostat European Commission European Commission INSEE Reference chronology of turning points Trough 1960M12, Peak 1963M10, Trough 1968M5, Peak 1971M10, Trough 1972M7, Peak 1974M2, Trough 1975M7, Peak 1979M12, Trough 1981M2, Peak 1982M5, Trough 1983M10, Peak 1986M5, Trough 1987M3, Peak 1990M1, Trough 1993M10, Peak 1995M2, Trough 1997M2, Peak 2000M11, Trough 2003M6, Peak 2008M1, Trough 2009M6, Peak 2011M9, Trough 2013M2, Peak 2014M9, Trough 2016M8, Peak 2017M12 OECD Composite Leading Indicators http://www.oecd.org/std/leading - indicators/ 12 Germany Component Series (Unit) Source I FO business climate indicator (normal=100) Orders inflow/demand (manuf.) : tendency (% balance) Export or der books (manuf. ) : expectation (% balance) N ew orders in manuf. industry ( 2010 = 100) Finished goods stocks (manuf . ) : level (% balance) inverted Spread of interest rates (% p . a . ) Services – Demand evolution: future tendency (% balance) Consumer - Confidence indicator sa (% balance) I FO Institute for Economic Research IFO Institute for Economic Research I FO Institute for Economic Research DESTATIS Federal Statistical Office European Commission European Central Bank European Commission European Commission Reference chronology of turning points Peak 1960M11, Trough 1963M2, Peak 1966M2, Trough 1967M5, Peak 1970M8, Trough 1972M2, Peak 1973M4, Trough 1975M6, Peak 1979M11, Trough 1982M10, Peak 1985M9, Trough 1987M4, Peak 1991M3, Trough 1993M9, Peak 1994M12, Trough 1996M2, Peak 1998M1, Trough 1998M12, Peak 2001M4, Trough 2005M2, Peak 2008M2, Trough 2009M6, Peak 2011M7, Trough 2013M3, Peak 2014M2, Trough 2015M6, Peak 2017M11 OECD Composite Leading Indicators http://www.oecd.org/std/leading - indicators/ 13 Greece Component Series (Unit) Source Cost of construction: residential (materials) ( 2015=100 ) inverted Bank credit to the manufacturing sector deflated sa (euro 2001) Services - Employment: future tendency sa (% balance) Manufacturing - Production: future tendency sa (% balance) Production of manufactured non - durable consumer goods sa ( 20 15=100 ) Total retail trade (Volume) sa ( 2015=100 ) Retail trade - Volume of stocks: level sa (% balance) inverted Domestic PPI Industrial activities ( 2015=100 ) inverted National Statistical Service of Greece Bank of Greece European Commission European Commission National Statistical Service of Greece National Statistical Service of Greece European Commission National Statistical Service of Greece Reference chronology of turning points Peak 1961M5, Trough 1962M8, Peak 1965M7, Trough 1968M5, Peak 1973M6, Trough 1974M9, Peak 1979M2, Trough 1981M3, Peak 1981M12, Trough 1983M5, Peak 1985M11, Trough 1987M6, Peak 1989M11, Trough 1990M8, Peak 1991M12, Trough 1993M12, Peak 1994M10, Trough 1996M2, Peak 1998M1, Trough 2000M2, Peak 2000M12, Trough 2002M2, P eak 2004M2, Trough 2005M6, Peak 2008M4, Trough 2012M7, Peak 2015M1, Trough 2016M9 OECD Composite Leading Indicators http://www.oecd.org/std/leading - indicators/ 14 Hungary Component Series (Unit) Source Manufacturing - Production: future tendency sa (% balance) Registered unemployment: level (all persons) sa Monthly hours worked: manufacturing sa (hours) Monetary aggregate M1 sa ( HUF ) Share prices: BUX index ( 2015=100 ) Central bank base rate (% per annum) ITS Imports c.i.f. total sa (HUF ) European Commission Hungarian Central Statistical Office Hungarian Cen tral Statistical Office Bank of Hungary Bank of Hungary Bank of Hungary Hungarian Central Statistical Office Reference chronology of turning points Trough 1996M9, Peak 1998M6, Trough 1999M3, Peak 2000M12, Trough 2003M4, Peak 2008M5, Trough 2009M6, Peak 2011M9, Trough 2012M12, Peak 2015M3, Trough 2016M10 OECD Composite Leading Indicators http://www.oecd.org/std/leading - indicators/ 15 Iceland Component Series (Unit) Source Cement sales index Current economic situation CPI HICP All items Spread of interest Passengers cars registration sa ICEX Main share price index Passengers through Keflavik Statistics I c eland Statistics I c eland Statistics I c eland Central Bank of Iceland Statistics I c eland http://www.nasdaqomxnordic.com/indexes Statistics I c eland Reference chronology of turning points Trough 1961M9, Peak 1966M7, Trough 1969M12, Peak 1971M9, Trough 1972M10, Peak 1974M1, Trough 1975M12, Peak 1978M1, Trough 1979M3, Peak 1981M12, Trough 1983M9, Peak 1987M8, Trough 1989M4, Peak 1991M1, Trough 1992M10, Peak 1994M5, Trough 1995M7, Peak 1998M11 , Trough 2003M8, Peak 2007M12, Trough 2010M6, Peak 2013M9, Trough 2015M12, Peak 2016M10 OECD Composite Leading Indicators http://www.oecd.org/std/leading - indicators/ 16 Ireland Component Series (Unit) Source Exports to Northern Ireland sa (EUR) Exports of agricultural products to other Euro sa (EUR) Passenger car registration s sa ( 2015=100 ) Total PP I Mining and quarrying activiti es ( 2015=100 ) Share prices: ISEQ index ( 2015=100 ) Real effective exchange rates - CPI Based ( 2015=100 ) inverted Money supply M2 to Euro area (EUR) Central Statistics Office Ireland Central Statistics Office Ireland Central Statistics Office Ireland Eurostat Central Bank of Ireland OECD, Economic Department Central Statistics Office Ireland Reference chronology of turning points Peak 1961M7, Trough 1962M6, Peak 1964M4, Trough 1966M8, Peak 1969M5, Trough 1971M2, Peak 1972M12, Trough 1974M4, Peak 1975M4, Trough 1976M8, Peak 1978M6, Trough 1980M5, Peak 1982M2, Trough 1983M7, Peak 1985M2, Trough 1986M9, Peak 1990M7, Trough 1994M2, Peak 1995M9, Trough 1996M10, Peak 1997M9, Trough 1998M12, Peak 2000M8, T rough 2003M5, Peak 2007M11, Trough 2009M8, Peak 2010M11, Trough 2013M4, Peak 2015M6, Trough 2017M4 OECD Composite Leading Indicators http://www.oecd.org/std/leading - indicators/ 17 Israel Component Series (Unit) Source Manufacturing - Production: future tendency sa (% balance) Total retail trade (Volume) sa ( 2015=100 ) Domestic PPI Manufacturing ( 2015=100 ) Share prices: TA 100 index ( 2015=100 ) Total Departures Of Israelis sa (number) Exports of manufactures diamonds prices 2010 (USD) Bank of Israel Central Bureau of Statistics Central Bureau of Statistics Tel - Aviv Stock Exchange Ban k of Israel Bank of Israel Reference chronology of turning points Peak 1997M1, Trough 1999M1, Peak 2000M9, Trough 2003M9, Peak 2007M12, Trough 2009M6, Peak 2011M9, Trough 2012M9, Peak 2014M11, Trough 2015M10, Peak 2018M1 OECD Composite Leading Indicators http://www.oecd.org/std/leading - indicators/ 18 Italy Component Series (Unit) Source Consumer - Confidence indicator sa (% balance) Manufacturing - Order books: level sa (% balance) Deflated orders for total manufactured goods (Value) sa ( 2010 = 100) Manufacturing - Production: future tendency sa (% balance) CPI All items ( 2010 =10) inverted Imports from Germany c.i.f. (USD) European Commission European Commission ISTAT European Commission ISTAT ISTAT Reference chronology of turning points Trough 1960M10, Peak 1962M1, Trough 1965M1, Peak 1970M7, Trough 1972M11, Peak 1974M3, Trough 1975M6, Peak 1976M11, Trough 1977M10, Peak 1979M12, Trough 1983M3, Peak 1985M9, Trough 1987M2, Peak 1989M12, Trough 1993M8, Peak 1995M11, Trough 1997M1, Peak 1997M11, Trough 1999M3, Peak 2001M1, Trough 2003M7, Peak 2008M2, Trough 2009M5, Pea k 2011M5, Trough 2013M4, Peak 2017M11 OECD Composite Leading Indicators http://www.oecd.org/std/leading - indicators/ 19 Japan Component Series (Unit) Source Ratio of inventories to shipments sa ( 2015=100 ) inverted ITS Volume of imports/volume of exports sa ( 2015=100 ) Ratio loans to deposits sa (%) inverted Monthly hours worked: manufacturing sa ( 2015=100 ) Work started for dwellings sa ( 2015=100 ) Share prices: TOPIX index ( 2015=100 ) Spread of interest rates (% p.a. ) Small Business Survey: Sales tendency (% balance) Statistics Japan Japan Customs Bank of Japa n Statistics Japan Ministry of Construction Bank of Japan Bank of Japan Japan Finance Corporation for SMSE Reference chronology of turning points Peak 1961M12, Trough 1963M2, Peak 1964M4, Trough 1965M11, Peak 1970M3, Trough 1971M10, Peak 1973M4, Trough 1975M2, Peak 1979M6, Trough 1980M5, Peak 1982M3, Trough 1983M5, Peak 1985M9, Trough 1987M2, Peak 1990M8, Trough 1994M10, Peak 1997M1, Trough 1999M5, Peak 2001M1, Trough 2002M1, Peak 2004M3, Trough 2004M12, Peak 2008M2, Trough 2009M4, Peak 2010M8, Tr ough 2012M9, Peak 2013M11, Trough 2016M7, Peak 2017M9, Trough 2018M10 OECD Composite Leading Indicators http://www.oecd.org/std/leading - indicators/ 20 Korea Component Series (Unit) Source Manufacturing - Business situation: future (% balance) Share prices: KOSPI index ( 2010 = 100) Stocks of manufactured investment goods (volume) sa inverted Inventory circulation indicator (manufacturing) Spread of i nterest rate s (% p.a.) Net Barter Terms of trade ( 2015=100 ) Bank of Korea Bank of Kor ea National Statistical Office National Statistical Office National Statistical Office National Statistical Office Reference chronology of turning points Trough 1962M6, Peak 1964M12, Trough 1965M9, Peak 1969M9, Trough 1972M7, Peak 1973M12, Trough 1975M2, Peak 1979M3, Trough 1980M12, Peak 1984M4, Trough 1985M12, Peak 1988M2, Trough 1989M6, Peak 1991M11, Trough 1992M12, Peak 1997M6, Trough 1998M7, Peak 2000M7, Trough 2001M6, Peak 2002M8, Trough 2005M1, Peak 2007M12, Trough 2009M3, Peak 2010M12, Trough 2012M12, Peak 2014M2, Trough 2015M4, Peak 2017M8, Trough 2019M5 OECD Composite Leading Indicators http://www.oecd.org/std/leading - indicators/ 21 Latvia Reference chronology of turning points Trough 1996M4, Peak 1998M3, Trough 2002M1, Peak 2002M12, Trough 2004M10, Peak 2007M10, Trough 2010M6, Peak 2013M10, Trough 2016M8, Peak 2018M8 OECD Composite Leading Indicators http://www.oecd.org/std/leading - indicators/ 22 Lithuania Reference chronology of turning points Trough 1996M5, Peak 1998M6, Trough 1999M11, Peak 2001M2, Trough 2002M2, Peak 2003M9, Trough 2004M9, Peak 2007M12, Trough 2009M10, Peak 2014M3, Trough 2016M4, Peak 2019M3 OECD Composite Leading Indicators http://www.oecd.org/std/leading - indicators/ 23 Luxembourg Reference chronology of turning points Peak 1961M5, Trough 1963M3, Peak 1964M8, Trough 1968M2, Peak 1969M7, Trough 1971M5, Peak 1974M3, Trough 1975M9, Peak 1979M11, Trough 1983M3, Peak 1984M5, Trough 1985M6, Peak 1986M7, Trough 1987M10, Peak 1989M5, Trough 1990M5, Peak 1991M7, Trough 1992M10, Peak 1994M2, Trough 1996M9, Peak 2000M3, Trough 2003M2, Peak 2 003M11, Trough 2005M3, Peak 2007M7, Trough 2009M5, Peak 2011M2, Trough 2012M10, Peak 2016M8, Trough 2018M12 OECD Composite Leading Indicators http://www.oecd.org/std/leading - indicators/ 24 Mexico Component Series (Unit) Source Employees - Manufacturing (D) sa (%) Manufacturing - Employment: tendency sa (% balance) Manufacturing - Finished goods: tendency sa (% balance) inverted Manufacturing - Production: tendency sa (% balance) Yi�eld 10 - year US fed . Gov . securities (% p . a .). inverted CPP Rate (% p . a . ) inverted Real effective exchange rates - CPI Based ( 2015=100 ) INEGI Bank of Mexico Bank of Mexico Bank of Mexico US Treasury Department USA Bank of Mexico OECD Reference chronology of turning points Trough 1962M9, Peak 1964M8, Trough 1967M6, Peak 1968M7, Trough 1971M7, Peak 1973M9, Trough 1977M7, Peak 1981M8, Trough 1983M6, Peak 1985M7, Trough 1986M11, Peak 1992M7, Trough 1993M5, Peak 1994M8, Trough 1995M7, Peak 1998M2, Trough 1999M6, Peak 2000M7, Trough 2003M8, Peak 2008M5, Trough 2009M5, Peak 2012M9, Trough 2013M10, Peak 2018M3 OECD Composite Leading Indicators http://www.oecd.org/std/leading - indicators/ 25 Netherlands Component Serie s (Unit) Source Manufacturing - Order books: level sa (% balance) Manufacturing - Production: future tendency sa (% balance) Manufacturing - Finished goods stocks: level sa (% balance) inverted Manufacturing - Business situation of Germany: present sa (normal=100) Services – Demand evolution: future tendency (% balance) Consumer - Confidence indicator sa (% balance) Share prices: AEX index ( 2015=100 ) European Commission European Commission European Commission I FO Institute Germany European Commission European Commission Statistics Netherlands Reference chronology of turning points Trough 1961M9, Peak 1965M1, Trough 1967M6, Peak 1970M12, Trough 1972M8, Peak 1974M5, Trough 1975M4, Peak 1976M8, Trough 1977M5, Peak 1979M11, Trough 1982M12, Peak 1986M5 , Trough 1987M2, Peak 1990M9, Trough 1993M12, Peak 1994M12, Trough 1996M3, Peak 2000M11, Trough 2005M1, Peak 2008M4, Trough 2009M6, Peak 2011M4, Trough 2013M4, Peak 2015M3, Trough 2015M12, Peak 2018M3 OECD Composite Leading Indicators http://www.oecd.org/std/leading - indicators/ 26 New Zealand Component Series (Unit) Source Manufacturing - Business situation: future sa (% balance) Consumer - Confidence indicator sa (% balance) Total retail trade (Value) sa ( NZD ) Short term unemployment sa (persons) inverted Monetary aggregate M 1 sa ( 2015=100 ) Yield of 90 - day bank bills (% p . a . ) inverted New Zealand Inst. Economic Research Westpac Banking Corporation N.Z. Statistics New Zealand Department of Labour N. Z. Reserve Bank N. Z. Reserve Bank N. Z. Reference chronology of turning points Trough 1962M7, Peak 1966M5, Trough 1968M3, Peak 1969M7, Trough 1970M11, Peak 1974M5, Trough 1975M8, Peak 1976M5, Trough 1977M10, Peak 1978M9, Trough 1980M5, Peak 1982M5, Trough 1983M2, Peak 1985M1, Trough 1987M2, Peak 1989M2, Trough 1992M10, Peak 1995M6, Trough 1998M6, Peak 2000M2, Trough 2001M2, P eak 2004M3, Trough 2005M1, Peak 2007M9, Trough 2009M2, Peak 2010M3, Trough 2013M10, Peak 2017M10 OECD Composite Leading Indicators http://www.oecd.org/std/leading - indicators/ 27 Norway Component Series (Unit) Source Exports to UK (USD) Manufacturing , mining and quarrying - Stocks of orders for export sa (% balance) Manufacturing - Production: tendency sa (% balance) Manufacturing , mining and quarrying - General judgment of the outlook for the enterprise in next quarter sa (% balance) CPI All items ( 2015=100 ) Share prices: OSE20GI index ( 2015=100 ) UN – Comtrade database Statistics Norway Statistics Norway Statistics Norway Statistics Norway Oslo Børs Reference chronology of turning points Peak 1961M7, Trough 1963M5, Peak 1965M5, Trough 1966M5, Peak 1967M6, Trough 1968M7, Peak 1969M6, Trough 1970M9, Peak 1972M6, Trough 1975M5, Peak 1976M7, Trough 1979M2, Peak 1980M2, Trough 1982M10, Peak 1986M10, Trough 1989M2, Peak 1992M5, Trough 1993M3, Peak 1998M2, Trough 1999M3, Peak 2001M9, Trough 2003M6, Peak 2007M10, Trough 2010M8, Peak 2012M3, Trough 2012M12, Peak 2015M7, Trough 2016M8, Peak 2017M8 OECD Composite Leading Indicators http://www.oecd.org/std/leading - indicators/ 28 Poland Component Series (Unit) Source Real effective exchange rates - CPI Based ( 2015=100 ) inverted 3 - month WIBOR (% per annum) inverted Manufacturing - Production: tendency sa (% balance) Job vacancies: unfilled sa (number) Production of coal (tonnes) OECD Bank of P oland European Commission Central Statistical Office Central Statistical Office Reference chronology of turning points Peak 1998M1, Trough 1999M1, Peak 2000M11, Trough 2003M1, Peak 2004M3, Tro ugh 2005M5, Peak 2008M2, Trough 2009M7, Peak 2011M10, Trough 2013M11, Peak 2015M9, Trough 2016M7, Peak 2018M7, Trough 2019M5 OECD Composite Leading Indicators http://www.oecd.org/std/leading - indicators/ 2 9 Portugal Component Series (Unit) Source Industrial production: electricity, gas & water ( 2015=100 ) Manufacturing - Production: future tendency sa (% balance) Manufacturing - Order books: level sa (% balance) Manufacturing - Export order books: level sa (% balance) Share prices: PSI - 20 index ( 2015=100 ) Job vacancies: unfilled sa (number) Services – Demand evolution: future tendency (% balance) INE European Commission European Commission INE Lisbon Stock Exchange INE European Commission Reference chronology of turning points Trough 1961M2, Peak 1962M7, Trough 1964M1, Peak 1965M5, Trough 1966M10, Peak 1968M5, Trough 1969M7, Peak 1970M6, Trough 1972M2, Peak 1973M11, Trough 1975M8, Peak 1977M4, Trough 1978M7, Peak 1980M2, Trough 1981M8, Peak 1983M1, Trough 1984M5, Peak 1990M10, Trough 1993M12, Peak 2001M12, Trough 2003M6, Peak 2004M5, Trough 2005M10, Peak 2008M2, Trough 2009M4, Peak 2010M10, Trough 2012M12, Peak 2015M4, Trough 2016M2, Peak 2018M2 OECD Composite Leading Indicators http://www.oecd.org/std/leading - indicators/ 30 Slovak Republic Component Series (Unit) Source Retail trade - Confidence indicator sa (% balance) Total retail trade (Volume) sa ( 2015=100 ) Consumers - Expected economic situation sa (% balance) Share prices: SAX index ( 2015=100 ) ITS Imports c.i.f. total sa (USD) European Commission Eurostat European Commission Bratislava Stock Exchange Eurostat Reference chronology of turning points Trough 1993M9, Peak 1997M7, Trough 1999M12, Peak 2003M3, Trough 2004M5, Peak 2007M12, Trough 2009M5, Peak 2012M1, Trough 2013M9, Peak 2015M9, Trough 2016M12, Peak 2018M8 OECD Composite Leading Indicators http://www.oecd.org/std/leading - indicators/ 31 Slovenia Component Series (Unit) Source IP Manufacture Basic Metals sa ( 2015=100 ) Manufacturing - Order books: level sa (% balance) Manufacturing - Production: tendency sa (% balance) CPI All items ( 2015=100 ) inverted EUR/USD exchange rate monthly average (%) Consumers - Expected economic situation sa (% balance) Statistical Office of the Republic of Slovenia European Commission European Commission Statistical Office of the Republic of Slovenia O E CD European Commission Reference chronology of turning points Peak 1997M7, Trough 1998M9, Peak 2000M9, Trough 2005M1, Peak 2008M5, Trough 2009M7, Peak 2011M4, Trough 2013M2, Peak 2014M8, Trough 2015M11, Peak 2018M7 OECD Composite Leading Indicators http://www.oecd.org/std/leading - indicators/ 32 Spain Component Series (Unit) Source Manufacturing - Rate of capacity utilization sa (% balance) Construction - Employment: future tendency sa (% balance) CPI Services less housing ( 2015=100 ) inverted Share prices: IGBM general index ( 2015=100 ) Passenger car registrations ( 2015=100 ) Consumer - Confidence indicator sa (% balance) European Commission European Commission Instituto Nacional de Estadística Bank of Spain Asociación Española de Fabricantes de Automóviles y Camiones European Commission Reference chronology of turning points Peak 1963M4, Trough 1965M9, Peak 1966M8, Trough 1967M12, Peak 1969M4, Trough 1971M3, Peak 1974M4, Trough 1975M10, Peak 1978M2, Trough 1979M5, Peak 1980M5, Trough 1981M11, Peak 1983M5, Trough 1986M10, Peak 1991M10, Trough 1993M6, Peak 1995M6, Trough 1996M12, Peak 2000M11, Trough 2004M4, Peak 2008M2, Trough 2009M7, Peak 2011M3, Trough 2013M8, Peak 2017M8 OECD Composite Leading Indicators http://www.oecd.org/std/leading - indicators/ 33 Sweden Component Series (Unit) Source Yield 5 - year government bonds (% p.a.) inverted Overtime hours worked mining & m anuf . (%) Orders for total manufactured goods (Volume) sa ( 2015=100 ) Order books (manuf.) : level (% balance) Manufacturing - Finished goods stocks: level sa (% balance) inverted Services – Demand evolution: future tendency (% balance) Consumer - Confidence indicator sa (% balance) Share prices: OMXS30 index ( 2015=100 ) Bank of Sweden Statistics Sweden Statistics Sweden European Commission European Commission European Commission European Commission Bank of Sweden Reference chronology of turning points Peak 1961M2, Trough 1963M2, Peak 1964M12, Trough 1967M12, Peak 1970M9, Trough 1972M3, Peak 1974M12, Trough 1977M10, Peak 1980M1, Trough 1983M4, Peak 1984M2, Trough 1986M12, Peak 1990M1, Trough 1993M3, Peak 1995M9, Trough 1996M12, Peak 2000M7, Trough 2003M6, Peak 2007M11, Trough 2009M8, Peak 2011M5, Trough 2013M7, Peak 2015M10, Trough 2016M12 OECD Composite Leading Indicators http://www.oecd.org/std/leading - indicators/ 34 Switzerland Component Series (Unit) Source Manufacturing - Finished goods stocks: level (% balance) inverted Manufacturing - Orders inflow: tendency sa (% balance) Manufacturing - Production: future tendency sa (% balance) Share prices: UBS - 100 index ( 2015=100 ) Consumer - Expected economic situatio n sa (% balance) Silver prices ( CHF/ kJ) Swiss Economic Institute KOF/ETH Swiss Economic Institute KOF/ETH Swiss Economic Institute KOF/ETH Swiss Exchange Swiss State Secretariat for Economic Affairs (SECO) & Konso Basel Swiss National Bank Reference chronology of turning points Peak 1961M11, Trough 1963M2, Peak 1964M5, Trough 1966M1, Peak 1967M1, Trough 1969M2, Peak 1971M7, Trough 1972M4, Peak 1974M3, Trough 1975M12, Peak 1977M9, Trough 1978M9, Peak 1981M6, Trough 1983M1, Peak 1985M10, Trough 1987M4 , Peak 1990M4, Trough 1993M1, Peak 1994M9, Trough 1996M10, Peak 1998M5, Trough 1999M3, Peak 2000M11, Trough 2003M5, Peak 2008M4, Trough 2009M5, Peak 2011M3, Trough 2012M11, Peak 2014M10, Trough 2017M3, Peak 2018M4 OECD Composite Leading Indicators http://www.oecd.org/std/leading - indicators/ 35 Turkey Component Series (Unit) Source Production of electricity sa (GW hours) Manufacturing - Finished goods stocks: level sa (% balance) inverted New domestic orders: tendency sa (% balance) Manufacturing - Employment: f uture tendency sa (% balance) Prospects for exports (manuf . ) (% balance) Discounted treasury auction interest rate (% p . a . ) inverted ITS Import c.i.f. of intermediate goods sa ( USD ) Services – Demand evolution: future tendency (% balance) State Institute of Statistics Bank of Turkey Bank of Turkey Bank of Turkey Bank of Turkey B ank of Turkey State Institute of Statistics European Commission Reference chronology of turning points Trough 1961M10, Peak 1963M8, Trough 1965M6, Peak 1966M8, Trough 1967M8, Peak 1968M8, Trough 1971M4, Peak 1972M6, Trough 1973M11, Peak 1976M9, Trough 1980M7, Peak 1981M10, Trough 1982M7, Peak 1984M6, Trough 1985M8, Peak 1987M11, Trough 1989M5, Peak 1993M8, Trough 1994M7, Peak 1998M2, Trough 1999M9, Peak 2000M8, Trough 2001M10, Peak 2008M1, Trough 2009M4, Peak 2011M8, Trough 2012M7, Peak 2 015M7, Trough 2016M8, Peak 2018M1, Trough 2019M2 OECD Composite Leading Indicators http://www.oecd.org/std/leading - indicators/ 36 United Kingdom Component Series (Unit) Source Services – Demand evolution: future tendency (% balance) Passenger car registrations sa (number) Consumer - Confidence indicator sa (% balance) Great British Pound Interbank LIBOR 3 Months Delayed (% p.a.) inverted Manufacturing - Production : future tendency sa (% balance) Share prices: FTSE LOCAL UK (£) index ( 2015=100 ) European Commission Society of Motor Manufacturers and Traders European Commission Bank of England European Commission London Stock Exchan g e Reference chronology of turning points Peak 1955M9, Trough 1959M1, Peak 1960M2, Trough 1962M12, Peak 1964M9, Trough 1966M12, Peak 1968M8, Trough 1970M2, Peak 1973M4, Trough 1975M8, Peak 1979M6, Trough 1981M4, Peak 1983M10, Trough 1984M7, Peak 1988M12, Trough 1992M6, Peak 1994M10, Trough 1996M7, Peak 1998M3, Trough 1999M4, Peak 2001M6, Trough 2002M7, Peak 2003M11, Trough 2004M11, Peak 2008M1, Trough 2009M7, Peak 2015M10, Trough 2018M4 OECD Composite Leading Indicators http://www.oecd.org/std/leading - indicators/ 37 United States Component Series (Unit) Source Work started for dwellings sa (number) Net new orders - durable goods sa ( USD ) Share prices: NYSE composite ( 2015=100 ) Consumer - Confidence indicator sa (normal = 100) Weekly hours worked: manufacturing sa (hours) Manufacturing - Industrial confidence indicato r (% balance) Spread of interest rates (% p . a . ) Bureau of the Census Bureau of the Census New York Stock Exchange ( https://www.nyse.com/quote/index/NYA ) Survey of consumers – Thomson Reuters / University of Michigan Bureau of Labor Statistics Institute of Supply Management Federal Reserve Reference chronology of turning points Trough 1949M10, Peak 1951M8, Trough 1954M6, Peak 1955M9, Trough 1958M4, Peak 1959M6, Trough 1961M2, Peak 1962M3, Trough 1963M3, Peak 1966M3, Trough 1967M9, Peak 1969M3, Trough 1970M11, Peak 1973M5, Trough 1975M4, Peak 1978M11, Trough 1982M11, Peak 1984M7, Trough 1987M3, Peak 1989M6, T rough 1991M9, Peak 1994M9, Trough 1995M12, Peak 2000M5, Trough 2003M2, Peak 2007M10, Trough 2009M5, Peak 2012M4, Trough 2014M2, Peak 2015M4, Trough 2017M4, Peak 2018M7 OECD Composite Leading Indicators http://www.oecd.org/std/leading - indicators/ 38 Brazil Component Series (Unit) Source Share prices: BOVESPA - Total return index ( 2015=100 ) Manufacturing - Production: future tendency sa (% balance) Manufacturing - Order books: level sa (% balance) Central Bank Policy rate (EOP) (% p.a.) inverted Services – Demand evolution: future tendency (% balance) ITS Net trade (f.o.b. - f.o.b.) with EU (USD) Brazil Yahoo Finance and IMF Fundação Getulio Vargas , Brazil Fundação Getulio Vargas , Brazil IMF Fundação Getulio Vargas, Brazil Ministry of Development, Industry and Foreign Trade, Brazil Reference chronol ogy of turning points Peak 1997M9, Trough 1999M5, Peak 2000M12, Trough 2003M7, Peak 2004M9, Trough 2006M6, Peak 2008M5, Trough 2009M3, Peak 2011M4, Trough 2012M3, Peak 2013M11, Trough 2016M9 OECD Composite Leading Indicators http://www.oecd.org/std/leading - indicators/ 39 China Component Series (Unit) Source IP Production of chemical fertilizer sa (tonnes) IP Production of manufactured crude st ee l sa (tonnes) 5000 Industrial Enterprises: Diffusion Index: Overseas order level (%) Production of total construction sa (m2) Production of motor vehicles sa (number) Sha re prices: Shanghai Stock Exchange turnover ( CNY ) National Bureau of Statistics World Steel Association People`s Bank of China National Bureau of Statistics National Bureau of Statistics Shanghai Stock Exchange Reference chronology of turning points Trough 1978M12, Peak 1980M2, Trough 1982M11, Peak 1985M4, Trough 1986M4, Peak 1988M9, Trough 1990M5, Peak 1994M9, Trough 1999M7, Peak 2000M7, Trough 2002M1, Peak 2007M12, Trough 2009M2, Peak 2011M8, Trough 2012M11, Peak 2014M1, Trough 2016M8, Peak 2019M4 OECD Composite Leading Indicators http://www.oecd.org/std/leading - indicators/ 40 India Component Series (Unit) Source IP Production of manufactured durable consumer goods sa ( 2015=100 ) IP Prod u c tion of manufactured non - meta l lic mineral products sa ( 2015=100 ) Passenger car sales sa (number) Monetary aggregate M 1 sa ( INR ) Share prices: BSE (100) national index ( 2015=100 ) Call money rate (% p . a . ) inverted Ministry of Statistics Ministry of Statistics Society of Indian Automobile Manufacturers Reserve Bank of India Reserve Bank of India Reserve Bank of India Reference chronology of turning points Trough 1997M10, Peak 1999M12, Trough 2003M1, Peak 2007M9, Trough 2009M3, Peak 2010M12, Trough 2013M8, Peak 2018M3 OECD Composite Leading Indicators http://www.oecd.org/std/leading - indicators/ 41 Indonesia Component Series (Unit) Source Share prices: IDX composite index ( 2015=100 ) Central Bank Discount rate (% p . a . ) inverted IDR/USD exchange rate end period ( % ) inverted Wholesale Price Index ( 2015=100 ) inverted Consumer - Confidence indicator (normal = 100) Production of paper and paper products sa ( 2015=100 ) Tourist arrivals sa (number) Jakarta Stock Exchange Central Bank of Indonesia International Monetary Fund Central Bank of Indonesia Central Bank of Indonesia National Bureau of Statistics National Bureau of Statistics Reference chronology of turning points Trough 1993M3, Peak 1997M8, T rough 1998M10, Peak 2003M3, Trough 2004M4, Peak 2008M5, Trough 2009M5, Peak 2013M2, Trough 2016M12 OECD Composite Leading Indicators http://www.oecd.org/std/leading - indicators/ 42 Russian Federation Component Series (Unit) Source Manufacturing - Order books: level sa (% balance) Share prices: RTS index ( 2015=100 ) World market price of crude oil ( 2015=100 ) Manufacturing - Production: tendency sa (% balance) Manufacturing - Export order books: level sa (% balance) GAIDAR, Institute for Econom ic Policy Central Bank of R.F. Hamburg Institute of International Economics (HWWA) GAIDAR, Institute for Econom ic Policy GAIDAR, Institute for Econom ic Policy Reference chronology of turning points Trough 1996M10, Peak 1997M9, Trough 1998M10, Peak 2000M7, Trough 2002M4, Peak 2003M1, Trough 2005M5, Peak 2008M3, Trough 2009M7, Peak 2013M10, Trough 2016M5, Peak 2018M7 OECD Composite Leading Indicators http://www.oecd.org/std/leading - indicators/ 43 South Africa Component Series (Unit) Source Manufacturing - Orders inflow/Demand: tendency (% balance) Manufacturing - Confidence indicator (% balance) Permits issued for total buildings sa ( 2015=100 ) Passenger car registrations sa ( 2015=100 ) Share prices: FTSE / JSE index ( 2015=100 ) Spread of interest rates (% p . a . ) Bureau of Economic Research Bureau of Economic Research Reserve Bank Reserve Bank Internati onal Monetary Fund Reserve Bank Reference chronology of turning points Peak 1960M7, Trough 1962M12, Peak 1965M2, Trough 1966M10, Peak 1967M8, Trough 1969M3, Peak 1971M1, Trough 1972M8, Peak 1974M6, Trough 1977M10, Peak 1981M9, Trough 1983M4, Peak 1984M5, Trough 1986M6, Peak 1989M5, Trough 1992M12, Peak 1996M11, Trough 1998M12, Peak 2000M10, Trough 2003M11, Peak 2008M4, Trough 2009M9, Peak 2015M1, Trough 2017M1, Peak 2017M11 OECD Composite Leading Indicators http://www.oecd.org/std/leading - indicators/ 44 OECD Reference chronology of turning points Trough 1961M2, Peak 1962M2, Trough 1963M2, Peak 1964M3, Trough 1965M4, Peak 1966M4, Trough 1967M9, Peak 1969M5, Trough 1971M10, Peak 1973M5, Trough 1975M5, Peak 1979M9, Trough 1982M12, Peak 1985M9, Trough 1987M2, Peak 1990M5, Trough 1993M8, Peak 1994M11, T rough 1995M11, Peak 1997M10, Trough 1999M2, Peak 2000M7, Trough 2003M4, Peak 2008M1, Trough 2009M5, Peak 2011M12, Trough 2013M1, Peak 2015M5, Trough 2016M8, Peak 2018M1 OECD Composite Leading Indicators http://www.oecd.org/std/leading - indicators/ 45 OECD + non - member economies Reference chronology of turning points Trough 1961M2, Peak 1962M2, Trough 1963M2, Peak 1964M3, Trough 1965M4, Peak 1966M4, Trough 1967M9, Peak 1969M5, Trough 1971M10, Peak 1973M5, Trough 1975M5, Peak 1979M10, Trough 1982M12, Peak 1985M8, Trough 1987M2, Peak 1989M1, Trough 1993M7, Peak 1994M11, Trough 1995M12, Peak 1997M9, Trough 1998M11, Peak 2000M7, Trough 2003M4, Peak 2008M1, Trough 2009M5, Peak 2011M10, Trough 2012M12, Peak 2013M11, Trough 2016M7, Peak 2018M3 OECD Composite Leading Indicators http://www.oecd.org/std/leading - indicators/ 46 Major seven countries Reference chronology of turning points Trough 1961M1, Peak 1962M2, Trough 1963M2, Peak 1964M3, Trough 1965M2, Peak 1966M3, Trough 1967M7, Peak 1969M3, Trough 1971M3, Peak 1973M5, Trough 1975M5, Peak 1979M8, Trough 1982M11, Peak 1985M9, Trough 1987M2, Peak 1990M4, Trough 1993M8, Peak 1994M11, Tr ough 1996M1, Peak 1997M10, Trough 1999M3, Peak 2000M6, Trough 2003M3, Peak 2007M12, Trough 2009M5, Peak 2012M2, Trough 2012M12, Peak 2015M4, Trough 2016M8, Peak 2017M12 OECD Composite Leading Indicators http://www.oecd.org/std/leading - indicators/ 47 OECD Europe Reference chronology of turning points Peak 1962M5, Trough 1968M4, Peak 1970M8, Trough 1972M1, Peak 1973M10, Trough 1975M7, Peak 1979M12, Trough 1982M11, Peak 1985M9, Trough 1987M2, Peak 1990M4, Trough 1993M6, Peak 1995M6, Trough 1996M11, Peak 1998M1, Trough 1999M3, Peak 2000M9, Trough 2003M5, Peak 2008M2, Trough 2009M6, Peak 2011M6, Trough 2013M2, Peak 2015M9, Trough 2016M7, Peak 2017M12 OECD Composite Leading Indicators http://www.oecd.org/std/leading - indicators/ 48 Euro area Reference chronology of turning points Peak 1963M11, Trough 1968M4, Peak 1970M8, Trough 1972M3, Peak 1974M1, Trough 1975M6, Peak 1976M12, Trough 1977M9, Peak 1980M1, Trough 1982M12, Peak 1985M9, Trough 1987M3, Peak 1991M2, Trough 1993M9, Peak 1995M4, Trough 1997M1, Peak 1998M1, Trough 1999M1, P eak 2001M2, Trough 2003M6, Peak 2008M2, Trough 2009M6, Peak 2011M5, Trough 2013M3, Peak 2017M11 OECD Composite Leading Indicators http://www.oecd.org/std/leading - indicators/ 49 Four big European countries Reference chronology of turning points Peak 1962M5, Trough 1963M2, Peak 1965M8, Trough 1967M4, Peak 1970M8, Trough 1972M3, Peak 1973M9, Trough 1975M7, Peak 1976M12, Trough 1977M9, Peak 1979M11, Trough 1982M11, Peak 1985M8, Trough 1987M3, Peak 1991M2, Trough 1993M8, Peak 1995M2, Trough 1997M1, P eak 1998M1, Trough 1999M3, Peak 2001M3, Trough 2003M5, Peak 2008M2, Trough 2009M6, Peak 2011M6, Trough 2013M2, Peak 2017M11 OECD Composite Leading Indicators http://www.oecd.org/std/leading - indicators/ 50 NAFTA area Reference chronology of turning points Trough 1949M10, Peak 1951M8, Trough 1954M6, Peak 1955M9, Trough 1958M4, Peak 1959M6, Trough 1961M2, Peak 1962M3, Trough 1963M3, Peak 1966M3, Trough 1967M9, Peak 1969M2, Trough 1970M11, Peak 1973M5, Trough 1975M4, Peak 1978M11, Trough 1980M7, Peak 1981M4, T rough 1982M12, Peak 1985M9, Trough 1987M1, Peak 1990M3, Trough 1991M9, Peak 1994M8, Trough 1995M11, Peak 2000M6, Trough 2003M2, Peak 2007M10, Trough 2009M5, Peak 2012M3, Trough 2014M2, Peak 2015M4, Trough 2017M4, Peak 2018M6 OECD Composite Leading Indicators http://www.oecd.org/std/leading - indicators/ 51 Major five Asia Reference chronology of turning points Peak 1979M8, Trough 1983M3, Peak 1985M6, Trough 1987M2, Peak 1988M10, Trough 1990M2, Peak 1991M4, Trough 1993M9, Peak 1996M12, Trough 1998M8, Peak 2000M9, Trough 2002M1, Peak 2004M4, Trough 2005M1, Peak 2007M12, Trough 2009M3, Peak 2011M8, Trough 2012M11, Peak 2013M12, Trough 2016M8, Peak 2018M1