/
Real World Real World

Real World - PowerPoint Presentation

yoshiko-marsland
yoshiko-marsland . @yoshiko-marsland
Follow
434 views
Uploaded On 2016-07-08

Real World - PPT Presentation

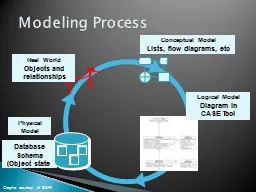
Objects and relationships Database Schema Object state Physical Model Modeling Process Conceptual Model Lists flow diagrams etc Logical Model Diagram in CASE Tool Graphic courtesy of ESRI ID: 396015

data model table measure model data measure table patient tables relationships diseaseid dimension schema disease bioweb diseasename patientdisease drug

Share:

Link:

Embed:

Download Presentation from below link

Download Presentation The PPT/PDF document "Real World" is the property of its rightful owner. Permission is granted to download and print the materials on this web site for personal, non-commercial use only, and to display it on your personal computer provided you do not modify the materials and that you retain all copyright notices contained in the materials. By downloading content from our website, you accept the terms of this agreement.


Presentation Transcript

Slide1

Real World

Objects and relationships

Database

Schema

(Object state

)

Physical Model

Modeling Process

Conceptual Model

Lists, flow diagrams,

etc

Logical Model

Diagram in CASE Tool

Graphic courtesy of ESRISlide2

Data Model Levels

Increasing

AbstractionReality

Conceptual ModelLogical Model

Physical Model

Human-oriented

Computer-orientedSlide3

Unified Modeling LanguageEntity-relationship diagrams

Design the methodologies, diagram notations

UMLNot a design methodologyJust a diagrammatic notation based on methods

Endorsed by leading software and database companiesSlide4

UML ( cont. )Diagrammatic notation = “visual language”...For constructing a data modelDrawings, relationships constructed in Visio (other tools available)Tools to input a drawing into

ArcGISinput drawing to the data model Slide5

UML Notationa class is shown as a box top part contains the name of the class lower part contains the attributes methods associated with the class lines connect boxes and indicate relationships Slide6

RelationshipsLinks between classes, shown as linesOne to oneOne to manyMany to manySlide7

BioWeb Schema: A Logical Data Model for the Biomedical DataKalyani Beerevelly

Gautami Reddy

ChittetiSlide8

Conceptual E-R Model

Clinical Sample

Medical Image

Followup

Drug

Demographics

Clinical Test

Physiology

Patient

1 n

n

n

n

1

n

1

n

1

n

n

n

Disease

n

n

nSlide9

Complex data structure with many potential dimensionsMany- to- many and Uncertain relationships between fact and dimension objectsRequire advanced temporal support for time validityIncomplete and/or imprecise data very common

Characteristics of Clinical and genomic dataSlide10

Neither Snow flake nor star schema is good to represent many-to-many relationships.BioStar model uses the concept of introducing bridge table in between fact table and dimension tables called the measure tables. The pitfall of BioStar model is - to retrieve particular data many joins are required.

SolutionsSlide11

Bio Star Schema

Patient

PatientID

SSN

Name

Gender

DOB

DrugUse

DrugID

PatientID

Dosage

ValidFrom

ValidTo

TestResult

TestID

PatientID

Result

DateTested

ClinicalSample

SampleID

PatientID

Source

Amount

DateTaken

Diagnosis

DiseaseID

PatientID

Symptom

ValidFrom

ValidTo

Drug

DrugID

DrugName

DrugType

Description

Disease

DiseaseID

Name

Type

Description

ClinicalTest

TestID

TestName

TestType

TestSettingSlide12

Idea--have one measure table for one or more related Dimension tables.For instance diagnosis measure table can have the measures of drug use and disease symptom since we can observe a valid relation between disease and the drugs used.This information can be very useful during the mining of the data.

Bio Web ModelSlide13

Bio Web Schema

Fact

FactKey

. . .

MTable234

DimKey2

DimKey3

DimKey4

FactKey

Measures…

Dim1

DimKey1

. . .

MTable124

DimKey1

DimKey2

DimKey4

FactKey

Measures…

Dim3

DimKey3

. . .

Dim1

DimKey4

. . .

Dim4

Dim1

DimKey2

. . .

Dim2Slide14

BioWeb Schema for Clinical data Slide15

This model reduces the number of physical joins. It is easy for consolidation of few results from the measure tables which couldn’t be made from bio star. For instance, from the diagnosis table it is easy to consolidate which disease has been treated using which drug. In the

BioStar model, this consolidation was not possible. What could be concluded was which patient was prescribed which drug and what disease did he suffer from separately.

Temporal attributes of the measure tables allow multiple entries. For instance, if the same patient is diagnosed on same day the measure tables allow in the BioWeb model. Benefits of BioWeb ModelSlide16

Adding a dimension to existing measure table or adding fields in any table would require re-computing data entries of the measure table. Hence measure table should not be connected to more number of dimension tables.Connecting multiple dimension tables to one measure table might increase the size of the measure table but on the brighter side this gives some direct results which could be very useful.

Pitfalls of BioWeb ModelSlide17

HierBioByChirag Gorasia (3454 8106)

Rahul Malviya

(3654 8590)Slide18

IntroductionHierarchical modelEasily models 1-1 and 1-n associations as parent-child relationships.Easily extensible and scalableVery efficient to retrieve and update records.

Fairly intuitive to construct.Real world implementation of Hierarchical models:

www.mismo.org and IBM IMSSlide19
Slide20

XML Representation for n-n association<

clinicalData

> <patient patientId=1000 SSN=000-00-0000 Name="ABC“ Gender=”M” DOB=09/16/2009 > <patientDisease diseaseId

=10000 diseaseName="XXX"

/> <patientDisease diseaseId=10001 diseaseName

="XXY" /> </patient>

<patient patientId=1001 SSN=000-00-0001 Name="ABCD“ Gender=”F” DOB=09/14/2009> <

patientDisease diseaseId=10000

diseaseName="XXX" /> </patient> < patientDisease

diseaseId=10000 diseaseName="XXX“ patient=1001,1000 /> < patientDisease diseaseId=10001 diseaseName

="XXY“ patient=1000 /></clinicalData>