/
Using Data Metrics to Demonstrate HR Strategic Value Using Data Metrics to Demonstrate HR Strategic Value

Using Data Metrics to Demonstrate HR Strategic Value - PowerPoint Presentation

yoshiko-marsland
yoshiko-marsland . @yoshiko-marsland
Follow
349 views
Uploaded On 2018-11-03

Using Data Metrics to Demonstrate HR Strategic Value - PPT Presentation

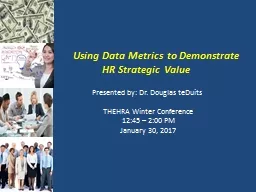
Presented by Dr Douglas teDuits   THEHRA Winter Conference 1 245 200 PM January 30 2017 Lord Kelvin To measure is to know If you can not measure it you can not improve it ID: 712207

costs employee performance strategy employee costs strategy performance scorecard turnover business measure amp measures employees cost strategic deliverables financial

Share:

Link:

Embed:

Download Presentation from below link

Download Presentation The PPT/PDF document "Using Data Metrics to Demonstrate HR Str..." is the property of its rightful owner. Permission is granted to download and print the materials on this web site for personal, non-commercial use only, and to display it on your personal computer provided you do not modify the materials and that you retain all copyright notices contained in the materials. By downloading content from our website, you accept the terms of this agreement.


Presentation Transcript

Slide1

Using Data Metrics to Demonstrate HR Strategic Value

Presented by: Dr. Douglas teDuits


THEHRA

Winter Conference

1

2:45 – 2:00 PM

January 30, 2017Slide2

Lord Kelvin

To

measure is to know

.

If

you can not measure it, you can not improve it

.

When

you can measure what you are speaking about, and express it in numbers, you know something about it; but when you cannot measure it, when you cannot express it in numbers, your knowledge is of a meagre and unsatisfactory

kind…Slide3

Strategy Implementation Barriers

Only 5% of the workforce understands the strategy

Only 25% of managers have their actions linked to organizational strategy

85% of executive teams spend less than an hour/month discussing strategy

60% of the organizations don’t link budgets to strategySlide4

HR StrategySlide5

Elements of an HR Scorecard

HR Deliverables:

Connected

to the

organization’s

business strategy.

Focus on just a

few key deliverables

,

linked to several performance drivers

, that the business senior line managers understand their significances and

are willing to pay for

.

Consider HR deliverables as

organization capabilities

. Organization capabilities that offer a

competitive advantage

are tough for the business to ignore.

Focus on HR

performance drivers

and HR enablers.

HR

Efficiencies “

doables

”:

Select

key efficiency metrics carefully.

Divide the metrics into CORE and STRATEGIC

Core

metrics measure significant costs

to the organization; however do not necessarily make a significant impact to the over-all strategy.

Strategic

metrics measure the HR Deliverables

tied to the Organization’s business strategy. Slide6

High Performance Workplace Practices

The

KSA’s

of a company’s current and future employees are influenced by:

Comprehensive employee recruitment and selection systems

Extensive employee involvement and training programs

Incentive-based compensation and performance management systems

The results include:

Increased employee motivation

Reduced shirking of responsibilities

Enhanced retention of quality employees

Encouragement of low performers to leave the

company

Gruber

, D.,

Smerek

, R., Thomas-Hunt, M., & James E. (2015)Slide7

Turnover ExamplePredictive variables for employees who have the intention to leave

Perceptions of job

insecurity

Manager/departmental turnover rates

Compensation

Job satisfaction

Tenure

Demographical variables (age, sex, education, etc.)

Organizational commitment

Job expectations met

Perceptions of organizational culture

Job enrichment interventions (reduced turnover)

Realistic job previews (reduced turnover) Slide8

Calculating Turnover

For

the last

12-month

period

, add up the number of voluntary resignations.

Next

divide by the total number of employees at the end of the same 12 month period

.

Multiple

by 100 to get %

Resignations

=

555

Number

of employees =

5000

555

÷

5000

= .11 x 100 = 11%Slide9

Cost of Employee Turnover

Turnover cost indicates how much turnover is costing and its impact on the operations of the agency.

Number

of

employees = 5000

Annual

turnover = 11

%

Number of employee turning

over = 555

Average

turnover cost per

employee =$1,694

Total annual

cost = $940,170

Savings from reducing turnover by

10% = $ 42,350 (555

x .

05 = 56) 56 fewer employees turning over 56 x $1694 = $94,864)Turnover costs also take into account indirect costs. Research indicates that the indirect costs of turnover can be 2 to 5 times higher than direct costs. These costs are more difficult to quantify and assign a dollar figure to, but they are very real.

Gruber, D.,

Smerek

, R., Thomas-Hunt, M., & James E. (2015)Slide10

Direct Costs of Turnover

Recruiting Costs

Advertising costs

Interviewing Costs (time spent x wage of the interviewer(s)

Referencing Costs (time spent x wage of the interviewer(s)

Administrative Costs (time spent x wage of administrator(s)

Processing of paper work for newly hired employee

Processing of paper work for exiting employee

Supervision Costs (time spent x the wages of the supervisor/manager

Training Costs (Time spent training (xx

hrs

) x wage of employee); (Time spent training (xx

hrs

) x wage of trainer(s); (Materials, equipment, job aides)

Separation Costs (Average cost of unemployment, separations pay, etc. ); (Overtime costs to do work of exiting employee )

Gruber, D.,

Smerek

, R. (2015)Slide11

HR Can Make a Difference Provide direct and economically significant contributions to the company

But you must have

effective

HRM

practices that are

linked to the strategic mission

Basic Requirement include

Must

add value

to the firm’s production processes

Skills the firm seeks must be

rare

Human capital investments are not easily replicated

(imitated)

Gruber

, D.,

Smerek

, R., Thomas-Hunt, M., & James E. (2015)Slide12

Proactive HRM Practices

Influence employee skills through

acquiring and developing human capital

Use

solid recruiting techniques

with

reliable and valid selection procedures

to assist with the

identification and development of the right employee

Provide

formal and informal training

that can further influence employee development

Skill development

OJT

Coaching/mentoring/

sponsering

Management developme

ntImportant to remember that even highly-skilled employees need to be motivated and encouraged to work harder and smarterHighly structured jobs, micromanagement, and not allowing employees to use their highly-honed talents will disempower employee successSlide13

Organizational Financial Performance

Financial returns associated with

people investments in progressive

HRM

systems are generally sustainable

HRM

practices

can produce considerable increases

Extensiveness

of recruiting, selection validity, use of formal selection procedures directed and positively related to firm profits

Adoption of employee

training programs and increased financial performance

Linking appraisals to compensation connected to firm profitability Slide14

The HR Scorecard

Who are HR’s customers?

How do we measure our customer satisfaction?

What are HR financial measures?

Example

Slide15

Creating An HR Scorecard: Four Elements

The HR Scorecard should contain the following four elements:

High-Performance Work System-

the elements specifically selected to assist HR

to

implement the strategy through the HR deliverables.

HR alignment with external systems-

matching the HR system to the requirements of the organization’s business strategy.

Key

HR deliverables-

are key human capital contributors to implementing the organization’s business strategy.

HR efficiency-

measurement of costs controls and productivity of HR performance.

Creating

an HR Scorecard: The HR Scorecard: Linking People. Strategy, and Performance by Brian E Becker, Mark

Huselid

and David Ulrich. Harvard Business School Press.

Cost Control

Value Creation Slide16

Creating an HR Scorecard

The four elements balance

Cost Control

and

Value Creation

Cost

control comes from measuring HR efficiency.

Value

Creation comes through measuring HR deliverables, external HR system alignment, and the High-Performance Work System.

A

strategic HR measurement system is

correctly balancing

efficiency and value creation

, while being guided by a broad strategy and not a narrow HR perspective.

Creating

an HR Scorecard: The HR Scorecard: Linking People. Strategy, and Performance by Brian E Becker, Mark

Huselid

and David Ulrich. Harvard Business School Press. Slide17

Lagging Indicators

Performance measures that

represent the consequences of actions already taken

Output measures,

easy to measure

but

difficult to influence or change

(already happened)

Financial Measures

Weight loss example – what is the lagging measure?

HR Examples? Slide18

Leading Indicators

Input based,

difficult to measure

but

easy to influence

Business drivers of lagging indicators

Relationship between leading and lagging (if/then)

If you improve the performance of a leading indicator, then you will improve/“drive” a better performance of the lagging indicator

HR examples

– lowering employee absenteeism will improve employee satisfaction

Factors that

measure progress toward HR goals

and HR Strategy Map (business drivers)

Actions HR does for organizational success over time

Weight loss example – what are the leading indicators? Slide19

Creating An HR Scorecard: Leading & Lagging Indicators

The HR Scorecard should contain the following four elements:

Leading Indicators- Typically “input” oriented.

High-Performance Work System

HR alignment with external systems

Lagging Indicators- Typically “output” oriented.

Key HR deliverables

HR efficiencies Slide20

Creating An HR Scorecard: STRATEGIC HR Metrics

Select the

HR metric(s)

that could be considered strategic based on the Organization’s Goal.

Company A has a business goal to have

qualified successors ready for promotion within three years

for each of the top positions in each division.

Talent Acquisition of managers - Time to fill.

Percentage of managers who have completed all e-training requirements in the Learning MGT system.

Numbers of managers per division rated

ready now

for promotion by their supervisors, who have also indicated

a willingness

to

relocate and

rated over 100 points on their leadership assessment score.

Average leadership assessment scores for managers in grades 20-25 (director level and above) Slide21

Creating An HR Scorecard: The Bottom Line

Use it to reinforce the distinction between HR

doables

and HR

deliverables

.

Use it to control costs and create the HR value proposition

Use it to measure leading indicators - Key performance drivers aligned to the company’s business plan

Use it to assist HR professionals to focus on what’s important

Slide22

Drs. Robert Kaplan & David Norton

"The balanced scorecard retains traditional financial measures. But

financial measures

tell the story of past events, an adequate story for industrial age companies for which investments in long-term capabilities and customer relationships were not critical for success. These financial measures are inadequate, however, for guiding and evaluating the journey that information age companies must make to create future value through investment in

customers

, suppliers,

employees

,

processes

, technology, and innovation."Slide23

Drs. Robert Kaplan & David NortonBenefits of Balanced Scorecards

Holistic – few key things

Integrates various corporate programs

Brings strategic measures to lower levels of the organization – role with overall organizational performance Slide24

Balanced Scorecard Model

Adapted from Robert S. Kaplan and David P. Norton, “Using the Balanced Scorecard as a Strategic Management System,” Harvard Business Review (January-February 1996): 76.Slide25

Financial Measures

Revenues

Costs

Net Operating Income (

NOI

)

Return on Investments (ROI)

Earnings Before Interest, Taxes and Depreciation (

EBITD

) –

N

et Income

Risk Assessments

Cost-Benefits Analysis Slide26

Internal Business Processes

Recruiting & Selection Process

Performance Management

Recognition and Rewards

Workforce Planning

Succession Planning

Data Sharing & Integrity

HR

S

atisfaction SurveysSlide27

Employees’ Learning and Growth

Increased Need for Knowledge Workers (people are the warehouse)

Leadership & Development

Skill Gaps & Improvements Employee Goals

Technology Skills

Learning is more than training

Mentoring &

Sponsoring

Opinion surveys & Engagement surveysSlide28

Customer Perspectives

Who are they?

What are their expectations?

Communications Systems

Customers Satisfaction

Employee Relations SurveysSlide29

Strategy MappingSlide30

Dashboards

Visual representations of the

most important measures

and targets identified that need to be achieved one or more of the the organizational/departmental strategy.Slide31

Excel DashboardsSlide32

More Creative DashboardsSlide33

Good DashboardSlide34

Bad DashboardSlide35

Annual Success Plan Regional Airlines

Safety

Finance

Reliability

Service

People