PPT-Supplementary Figure 1A:
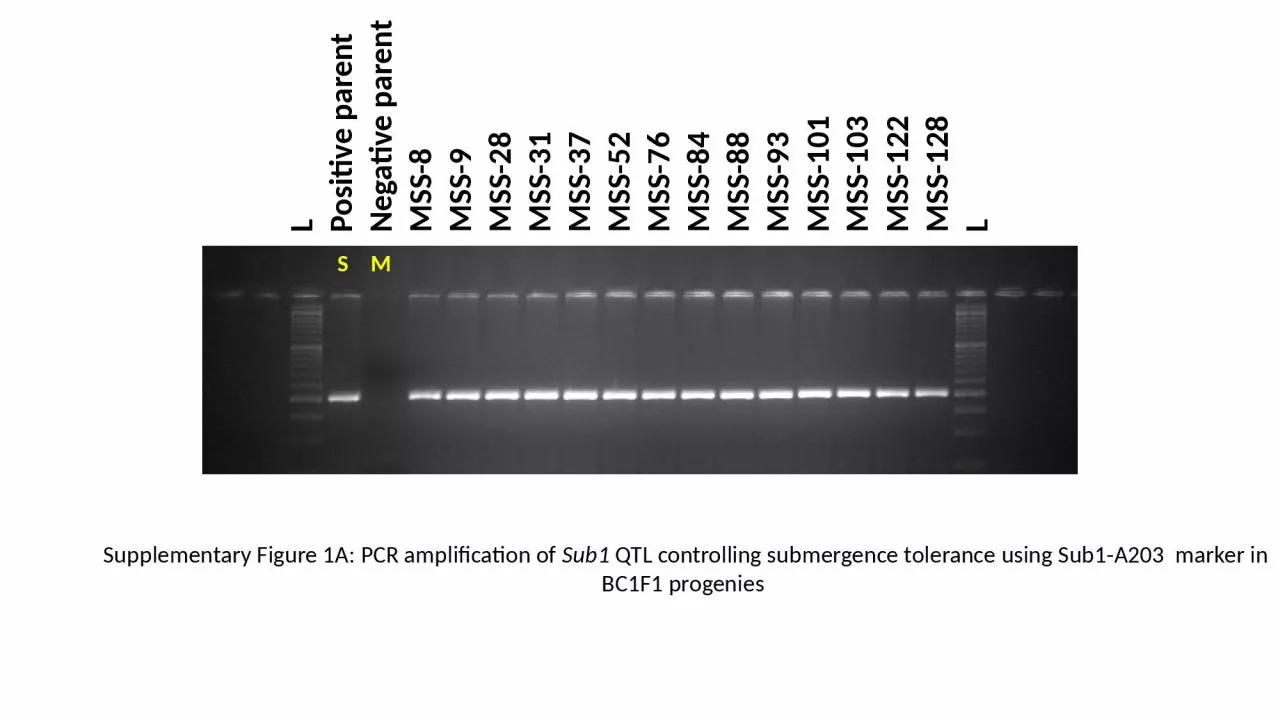
PCR amplification of Sub1 QTL controlling submergence tolerance using Sub1A203 marker in BC1F1 progenies L Positive parent Negative parent MSS8 MSS9 MSS28 MSS31
Download Presentation
"Supplementary Figure 1A:" is the property of its rightful owner. Permission is granted to download and print materials on this website for personal, non-commercial use only, provided you retain all copyright notices. By downloading content from our website, you accept the terms of this agreement.
Presentation Transcript
Transcript not available.