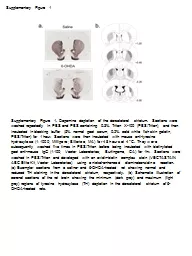
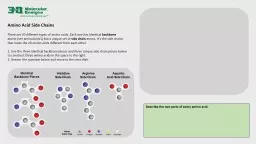
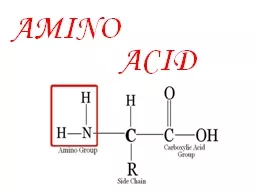
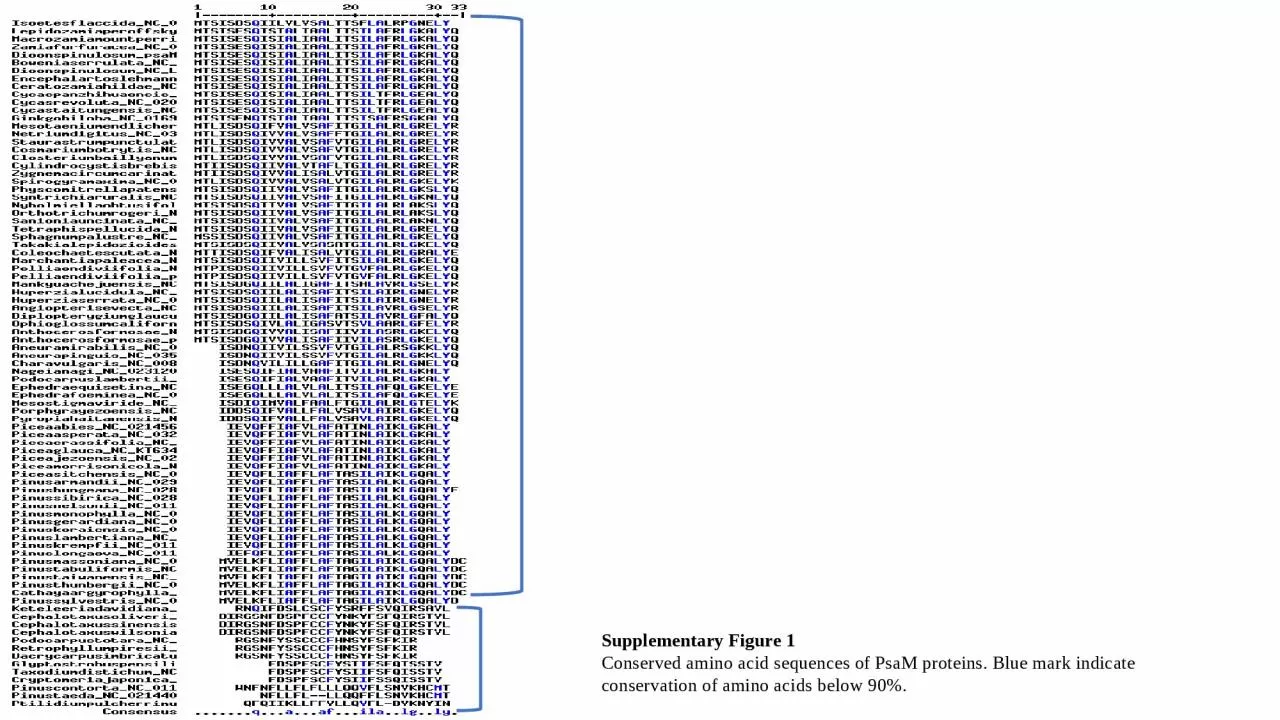
/
Supplementary Figure 1 Conserved amino acid sequences of Supplementary Figure 1 Conserved amino acid sequences of

Supplementary Figure 1 Conserved amino acid sequences of - PowerPoint Presentation

pagi
pagi . @pagi
Follow
0 views
Uploaded On 2024-02-16

Supplementary Figure 1 Conserved amino acid sequences of - PPT Presentation

PsaM proteins Blue mark indicate conservation of amino acids below 90 Supplementary Figure 2 A Phylogenetic tree of PsaM genes showing five clusters mentioned as 1 2 3 4 and 5 B ID: 1046325

figure nodes supplementary losses nodes figure losses supplementary genes leaf total internal size largest polytomy height chloroplast amino event

Share:

Link:

Embed:

Download Presentation from below link

Download Presentation The PPT/PDF document "Supplementary Figure 1 Conserved amino a..." is the property of its rightful owner. Permission is granted to download and print the materials on this web site for personal, non-commercial use only, and to display it on your personal computer provided you do not modify the materials and that you retain all copyright notices contained in the materials. By downloading content from our website, you accept the terms of this agreement.


Presentation Transcript

1. Supplementary Figure 1Conserved amino acid sequences of PsaM proteins. Blue mark indicate conservation of amino acids below 90%.

2. Supplementary Figure 2. (A) Phylogenetic tree of PsaM genes showing five clusters (mentioned as 1, 2, 3, 4, and 5). (B)Deletion and duplication event of PsaM genes.-Duplications: 12- Co-Divergences: 37- Transfers: 0- Losses: 34- Number of Temporally Feasible Optimal Solutions: 1Tree Without Losses- Total nodes: 171- Internal nodes: 85- Leaf nodes: 86- Polytomies: 0- Size of largest polytomy: 0- Height: 18Tree With Losses- Total nodes: 239- Internal nodes: 119- Leaf nodes: 120- Size of largest polytomy: 0Height: 22AB12345

3. Supplementary Figure 3Conserved amino acid sequences of Psb30 proteins. Red mark indicate conservation of amino acids of 90% or more.

4. Supplementary Figure 4. (A) Phylogenetic tree of Psb30 genes. (B) Deletion and duplication event of Psb30 genes.- Duplications: 39- Co-Divergences: 49- Transfers: 0- Losses: 120- Number of Temporally Feasible Optimal Solutions: 1Tree Without Losses- Total nodes: 313- Internal nodes: 156- Leaf nodes: 157- Polytomies: 0- Size of largest polytomy: 0- Height: 24Tree With Losses- Total nodes: 553- Internal nodes: 276- Leaf nodes: 277- Size of largest polytomy: 0- Height: 34AB

5. Supplementary Figure 5Conserved amino acid sequences of ChlB proteins. Red mark indicate conservation of 90% or more.

6. Supplementary Figure 6. (A) Phylogenetic tree of ChlB genes. (B) Deletion and duplication event of ChlB genes.- Duplications: 35- Co-Divergences: 116- Transfers: 0- Losses: 126- Number of Temporally Feasible Optimal Solutions: 1Tree Without Losses- Total nodes: 575- Internal nodes: 287- Leaf nodes: 288- Polytomies: 0- Size of largest polytomy: 0- Height: 34Tree With Losses- Total nodes: 827- Internal nodes: 413- Leaf nodes: 414- Size of largest polytomy: 0- Height: 37AB

7. Supplementary Figure 7Conserved amino acid sequences of ChlL proteins. Red mark indicate conservation of 90% or more.

8. Supplementary Figure 8. (A) Phylogenetic tree of ChlL genes. (B) Deletion and duplication event of ChlL genes.- Duplications: 49- Co-Divergences: 100- Transfers: 0- Losses: 184- Number of Temporally Feasible Optimal Solutions: 1Tree Without Losses- Total nodes: 565- Internal nodes: 282- Leaf nodes: 283- Polytomies: 0- Size of largest polytomy: 0- Height: 35Tree With Losses- Total nodes: 933- Internal nodes: 466- Leaf nodes: 467- Size of largest polytomy: 0- Height: 39AB

9. Supplementary Figure 9Conserved amino acid sequences of ChlN proteins. Red mark indicate conservation of 90% or more.

10. Supplementary Figure 10. (A) Phylogenetic tree of ChlN genes.(B) Deletion and duplication event of ChlN genes.- Duplications: 8- Co-Divergences: 34- Transfers: 0- Losses: 46- Number of Temporally Feasible Optimal Solutions: 1Tree Without Losses- Total nodes: 161- Internal nodes: 80- Leaf nodes: 81- Polytomies: 0- Size of largest polytomy: 0- Height: 17Tree With Losses- Total nodes: 253- Internal nodes: 126- Leaf nodes: 127- Size of largest polytomy: 0- Height: 23AB

11. Supplementary Figure 11Conserved amino acid sequences of Rpl21 proteins. Red mark indicate conservation of 90% or more.

12. Supplementary Figure 12. (A) Phylogenetic tree of Rpl21 genes. (B) Deletion and duplication event of Rpl21 genes.- Duplications: 3- Co-Divergences: 9- Transfers: 0- Losses: 8- Number of Temporally Feasible Optimal Solutions: 1Tree Without Losses- Total nodes: 43- Internal nodes: 21- Leaf nodes: 22- Polytomies: 0- Size of largest polytomy: 0- Height: 10Tree With Losses- Total nodes: 59- Internal nodes: 29- Leaf nodes: 30- Size of largest polytomy: 0- Height: 11AB

13. Molecular weight (kDa)Isoelectric point (pI)Supplementary Figure 13. Molecular weight and isoelectric point (pI) of RBCL proteins.

14. ABSupplementary Figure 14Recombination events of chloroplast genomes (A) unresolved (B) resolved. Chloroplast genomes were found to undergo vivid genomic recombination; which might be one of the possible reasons regarding the loss of the IR region in the chloroplast genomes. The color represents their link of recombination event in different taxon/groups. The genomic recombination of chloroplast genomes was studied using the IcyTree viewer (https://icytree.org/) server.

15. Supplementary Figure 15Recombination event of inverted repeat deleted chloroplast genomes. Each color indicates a locus and their distribution in different cluster indicates they have been undergone vivid recombination.

16. Supplementary Figure 16. Venn diagram showing group specific loss of chloroplast encoding genes in algae, gymnosperm, bryophyte, monocot, eudicot, and magnoliid.

17. Supplementary Figure 17. Venn diagram showing group specific loss of chloroplast encoding genes in algae, bryophyte, gymnosperm, angiosperm, pteridophyte and protist.

18. Supplementary Figure 18. Venn diagram showing group specific loss of chloroplast encoding genes in eudicot, gymnosperm, monocot, and magnoliid.