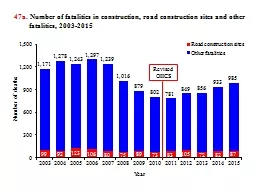
1 Number of fatalities in construction caughtinbetween and other fatalities 20032015 Note In 2011 the CFOI switched to OIICS version 201 therefore the numbers before and after 2011 are not comparable ID: 935090
Download Presentation The PPT/PDF document "I. Trends of Fatal Caught-in/between Inj..." is the property of its rightful owner. Permission is granted to download and print the materials on this web site for personal, non-commercial use only, and to display it on your personal computer provided you do not modify the materials and that you retain all copyright notices contained in the materials. By downloading content from our website, you accept the terms of this agreement.
Slide1
I. Trends of Fatal Caught-in/between Injuries in Construction (All employment)
Slide21
. Number of fatalities in construction, caught-in/between and other fatalities*, 2003-2015
Note
: In
2011, the CFOI switched to OIICS version
2.01, therefore the numbers before and after 2011 are not comparable.
* Other fatalities are fatalities from all causes except caught-in/between.
Source:
Fatal injury data were generated by the CPWR Data Center with restricted access to BLS CFOI micro data. The views expressed here do not necessarily reflect the views of the BLS.
Slide32
. Number
of fatal caught-in/between injuries in construction, 2003-2015
Note: In 2011, the CFOI switched to OIICS version
2.01,
therefore the numbers before and after 2011
are
not
comparable.
Source
:
Fatal injury data were generated by the CPWR Data Center with restricted access to BLS CFOI micro data. The views expressed here do not necessarily reflect the views of the BLS
.
Slide43.
Number of fatal
caught-in/between injuries, by major industry,
sum of 2011-2015
*Five deaths from
being
caught/compressed by equipment or objects, and nine deaths from being caught/crushed in collapsing materials.
Source:
Fatal injury data were generated by the CPWR Data Center with restricted access to BLS CFOI micro data. The views expressed here do not necessarily reflect the views of the BLS.
14*
Slide54. Fatal caught-in/between injuries in construction, by event or exposure, sum of 2011-2015
5a.
Number of fatal injuries from being caught or crushed in collapsing materials in
construction, by primary source, sum of 2011-2015
Note
: Solid elements include Bricks
, blocks, structural
stone, pipes, ducts, tubing, etc.
Source
:
Fatal injury data were generated by the CPWR Data Center with restricted access to BLS CFOI micro data. The views expressed here do not necessarily reflect the views of the BLS.
Slide75b.
Number of fatal injuries due to being caught or crushed in confined spaces,
by occupation in construction, sum of 2011-2015
Source:
Fatal injury data were generated by the CPWR Data Center with restricted access to BLS CFOI micro data. The views expressed here do not necessarily reflect the views of the BLS.
Slide86.
Number of fatal injuries in construction from being caught or compressed by object or equipment, selected primary source,
sum of 2011-2015
Source:
Fatal injury data were generated by the CPWR Data Center with restricted access to BLS CFOI micro data. The views expressed here do not necessarily reflect the views of the BLS.
Slide9II. Fatal Caught-in/between Injuries among
Construction
Subgroups
(All employment)
Slide107
. Number of fatal caught-in/between injuries, selected construction subsectors, sum of
2011-2015
Source:
Fatal injury data were generated by the CPWR Data Center with restricted access to BLS CFOI micro data. The views expressed here do not necessarily reflect the views of the BLS
.
Slide118
. Number of fatal
caught-in/between injuries in Site Preparation subsector, 2011-2015
Source:
Fatal injury data were generated by the CPWR Data Center with restricted access to BLS CFOI micro data. The views expressed here do not necessarily reflect the views of the BLS
.
Slide129. Number and rate
of
fatal caught-in/between injuries in construction,
selected
occupations
,
sum of 2011-2015
Source:
Fatal injury data were generated by the CPWR Data Center with restricted access to BLS CFOI micro data. Numbers of FTEs were estimated using the Current Population Survey. Calculations by the authors. The views expressed here do not necessarily reflect the views of the BLS.
Slide1310. Rate of fatal caught-in/between injuries in construction, selected worker characteristics,
average
of 2011-2015
Source:
Fatal injury data were generated by the CPWR Data Center with restricted access to BLS CFOI micro data.
Numbers
of FTEs were estimated using the Current Population Survey. Calculations by the authors
.
The views expressed here do not necessarily reflect the views of the BLS.
Slide1411. Percentage and rate of fatal caught-in/between injuries in construction,
by age
group,
average of 2011-2015
Source:
Fatal injury data were generated by the CPWR Data Center with restricted access to BLS CFOI micro data. Numbers of FTEs were estimated using the Current Population Survey. Calculations by the authors. The views expressed here do not necessarily reflect the views of the BLS.
Slide15III.
Trends of
Nonfatal Caught-in/between Injuries in Construction
(Private wage-and-salary workers)
Slide1612. Number and rate
of
nonfatal caught-in/between injuries resulting in days away from work in construction
,
2003-2015
Revised OIICS
Note
:
In 2011, the SOII switched to OIICS version 2.01, therefore the numbers before and after 2011
are
not comparable
.
Data cover private wage-and-salary workers.
Source: 2003-2015 Survey of Occupational Injuries and Illnesses
.
Slide1713. Number
of
nonfatal caught-in/between injuries in construction, by collapsing materials versus by object or equipment, 2003-2015
Note: In 2011, the
SOII switched
to OIICS version
2.01,
therefore the numbers before and after 2011
are
not
comparable.
Source
: 2003-2015 Survey of Occupational Injuries and Illnesses.
Slide1814a
. Number of
nonfatal injuries from being caught or compressed by object or equipment
, by major industry, 2
015
Source
:
2015
Survey of Occupational Injuries and Illnesses.
Slide1914b. Rate of nonfatal injuries from being caught or compressed by object or equipment, by major industry, 2
015
Source:
2015
Survey of Occupational Injuries and Illnesses.
Slide2015.
Nonfatal injuries in construction from being caught or compressed by object or equipment, selected primary sources,
2015
Source:
Numbers were obtained from the BLS through special
requests.
The views expressed here do not necessarily reflect the views of the BLS.
Slide21IV. Nonfatal Caught-in/between Injuries among Construction
Subgroups
(Private wage-and-salary workers)
Slide2216. Number and rate of nonfatal injuries from being caught or compressed by object or equipment, selected construction subsectors,
2015
Source:
2015
Survey of Occupational Injuries and Illnesses.
Slide2317. Number and rate of nonfatal caught or compressed by object or equipment injuries resulting in days away from work, selected construction occupations,
2015
* refers
to the Heating and Air Conditioning Mechanics occupation.
Source
:
Number of nonfatal injuries
were obtained from the BLS through special
requests. Numbers
of FTEs were estimated using the Current Population Survey.
Calculations by the authors.
Slide2418. Percentage and rate of nonfatal injuries from being caught or compressed by object or equipment in construction,
by age
group,
2015
Source:
Numbers were obtained from the BLS through special requests. Numbers of FTEs were estimated using the Current Population Survey. Calculations by the authors
.
The views expressed here do not necessarily reflect the views of the BLS.
Slide25V. Caught-in/between Prevention in Construction