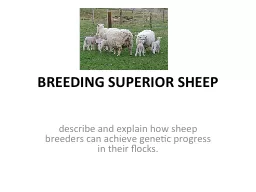
/
Identification, Validation, and Management of Mendelian Traits in Livestock Breeding Programs Identification, Validation, and Management of Mendelian Traits in Livestock Breeding Programs

Identification, Validation, and Management of Mendelian Traits in Livestock Breeding Programs - PowerPoint Presentation

LifeOfTheParty
LifeOfTheParty . @LifeOfTheParty
Follow
344 views
Uploaded On 2022-08-03

Identification, Validation, and Management of Mendelian Traits in Livestock Breeding Programs - PPT Presentation

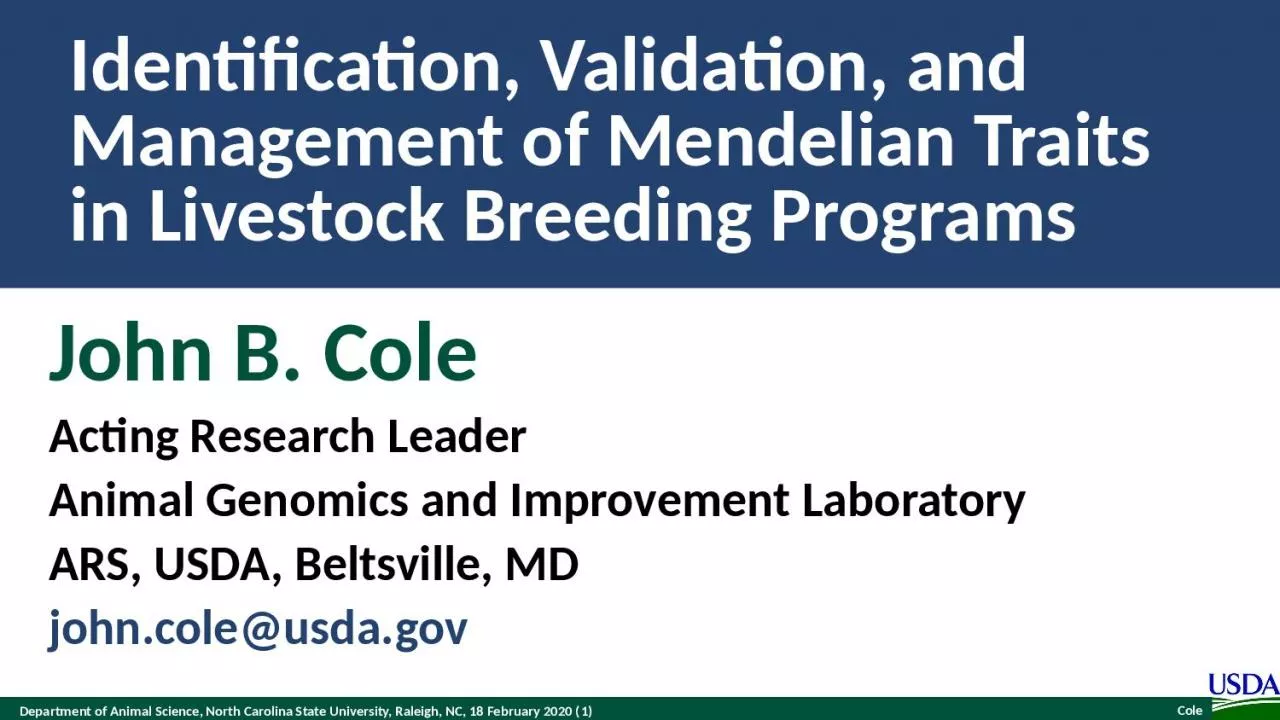
John B Cole Acting Research Leader Animal Genomics and Improvement Laboratory ARS USDA Beltsville MD johncoleusdagov Collaborators Derek M Bickhart 2 Jana L Hutchison 1 Daniel J Null ID: 933909

carrier pmid cole 2019 pmid carrier 2019 cole genetic hh2 bulls effects haplotypes 2016 fertility losses 2018 candidate validation

Share:

Link:

Embed:

Download Presentation from below link

Download Presentation The PPT/PDF document "Identification, Validation, and Manageme..." is the property of its rightful owner. Permission is granted to download and print the materials on this web site for personal, non-commercial use only, and to display it on your personal computer provided you do not modify the materials and that you retain all copyright notices contained in the materials. By downloading content from our website, you accept the terms of this agreement.


Presentation Transcript

Slide1

Identification, Validation, and Management of Mendelian Traits in Livestock Breeding Programs

John B. Cole

Acting Research Leader

Animal Genomics and Improvement Laboratory

ARS, USDA, Beltsville, MD

john.cole@usda.gov

Slide2

Collaborators

Derek M. Bickhart,

2

Jana L. Hutchison,

1

Daniel J. Null,

1

M. Sofia Ortega,

3

Christine F. Baes,

4

and Christian Maltecca

5

1

Animal Genomics and Improvement Laboratory, ARS, USDA, Beltsville, MD

2

Cell Wall Biology and Utilization Research Laboratory, U.S. Dairy Forage Research Center, ARS, USDA, Madison, WI

3

Division of Animal Sciences, College of Agriculture, Food, & Natural Resources, University of Missouri, Columbia, MO

4

Department of Animal

BioSciences

, University of Guelph, Ontario

5

Department of Animal Science, North Carolina State University, Raleigh, NC

Slide3

OverviewHow do we detect new genetic disorders?

Are incidence rates increasing?How do we validate causal variants?How do we manage geneticdisorders in our populations?Where do we go from here?

Slide4

Mendelian traitsOne locus, typically with two allelesOften exhibit complete dominance

Autosomal recessiveMany loci in cattle (Cole et al.,2018;

https://bit.ly/2utjPbT

)

Autosomal dominant

Polled

(

Medugorac

et al., 2011;

PMID: 22737241), MITF (Philippet al., 2011; PMID: 22174915)

Source:

https://

commons.wikimedia.org

/wiki/

File:Punnett_square_mendel_flowers.svg

.

Slide5

Genetic diseases are common

There currently are 532 genetic traits/disorders of cattle in the Online Mendelian Inheritance in Animals databasehttps://omia.org/home/

249

of these are Mendelian traits/disorders

Slide6

This not a dairy-specific problem!

Beef cattleJenko et al. (2019) reported 1 new lethal and 2 new semi-lethal haplotypes

Poultry

Youngworth

and Delany

(2019)

identified the causal variant for the Wingless-2 developmental syndrome

Pigs

Derks et al.

(2019) found 5 common recessive lethal haplotypes in 2 commercial populationsDogs

Oh, lord, dogs have all the genetic defects

Slide7

Haplotyping in US dairy cattle

Paternal and maternal chromosomes phased

Chromosomes divided into 100-SNP blocks

List of unique blocks in the population computed

What haplotypes never appear as homozygotes?

Automated part of genomic evaluation workflow

!

Parental Haplotypes

Progeny Haplotypes

Slide8

How are haplotypes affecting fertility detected?Lethal haplotypes found by searching for blocks that never appear as homozygotes even though a substantial number are expected

Fertility data used to determine if carrier  carrier matings have reduced fertility

Identifies recessives with effects early in gestation

Dystocia data can be used to check for effects on stillbirth rates

Identifies recessives with effects late in gestations

Methodology described in VanRaden et al.

(2011)

Slide9

Effects confirmed using fertility data

Carrier-to- carrier matings are tested for effects on conception rate and stillbirthEarly embryonic losses show conception rate effects (e.g., HH2

and

JH1

)

Some variants show stillbirth effects (e.g.,

BH2

and

HCD

)For example, matings of AH1 carrier sires to cows with AH1 carrier maternal grandsires had 6.1% lower sire conception rateBioinformatics used to identify putative causal variants

Slide10

Known recessives in U.S. Holsteins (February 2020)

1Timing of embryonic loss/calf death for homozygous animals: B = calf death at/shortly after birth, E = embryonic loss/abortion, W = calf death weeks/months after birth

(Cole et al., 2018; https://

bit.ly

/2utjPbT)

.

Haplo

-

type

Functional/

Gene

name

BTA

chromosome

Location

(

Mbp

)

Haplotype

frequency (%)

Timing

1

HBR

Black/red coat color/

MC1R

(

MSHR

)

18

14.8

0.75

HCD

Cholesterol deficiency/

APOB

11

78.0

2.28

W

HDR

Dominant red color/

MC1R

(

MSHR

)

3

9.5

0.03

HH0

Brachyspina

/

FANCI

21

21.2

1.65

E,B

HH1

APAF1

5

63.2

1.28

E

HH2

1

94.9

96.6

1.21

E

HH3

SMC2

8

95.4

2.64

E

HH4

GART

1

1.3

0.23

E

HH5

TFB1M

9

93.2

93.4

2.39

E

HH6

SDE2

16

29.0

29.1

0.44

W

HHB

BLAD/

ITGB2

1

145.1

0.21

W

HHC

CVM/

SLC35A3

3

43.4

1.10

E,B

HHD

DUMPS/

UMPS

1

69.8

0.01

E

HHM

Mule foot/

LRP4

15

77.7

0.05

B

HHP

Polledness

(dominant)

/

POLLED

1

1.7

2.0

0.88

HHR

Red coat color/

MC1R

(

MSHR

)

18

14.8

3.29

Slide11

Timing of recessive effectsLate losses are

more costly than early losses (Cole et al., 2016)Jenko et al. (2019)

found a similar pattern

A defect may cause deaths in

more than one

time period

Embryonic loss or abortion

Death at or near birth

Weeks or months following birth

BH1, HH0, HH1, HH2, HH3, HH4, HH5, CVM, JH1, JH2

BH2,

HH0, CVM, syndactyly (

mulefoot

)

AH1, BH2, HH6, BLAD, cholesterol

deficiency,

spinal

dysmyelination

, spinal muscular atrophy, weaver syndrome

Slide12

Estimated cost of genetic load

Cole et al. (2016) estimated annual losses of at least $10.7 million due to known recessives.Average losses were

$5.77

,

$3.65

,

$0.94

, and

$2.96

in Ayrshire, Brown Swiss, Holstein, and Jersey, respectively.This is the economic impact of genetic load as it affects fertility and perinatal mortality.Actual losses are likely to be higher.

Slide13

How many defects do animals carry?

Source:

Cole et al. (2016).

Slide14

Frequencies change over time

The best way to reduce the frequency of harmful alleles is to not use carrier bulls!

Slide15

Is the number of defects increasing?

MacArthur et al. (2012) estimated that human genomes contain ~100 loss-of-function mutations, and ~20 completely inactivated genesThe mutations are there even if we have not identified them yet

Example: HH6, mutation in

SDE2

(Fritz et al., 2018)

Our

detection methods are improving

as our technology improves

We continue to make many copies of haplotypes from a small number of bulls, uncovering existing genetic load

Slide16

Does pleiotropy affect traits of economic importance?Effects of recessive haplotypes on yield, fertility, and longevity

generally were small even when different from 0

Slide17

Validation of candidate variants

Candidate genes for early embryonic losses not always validated in the laboratoryTargeted knockouts can be used to validate candidates for early embryonic lossesRelatively fast and cost-effective

Source:

University of Florida (2013).

Slide18

Why is functional validation desirable?

Not all mutations produce phenotypic changeCompensatory networks can buffer against deleterious mutations (Rossi et al., 2015)

Many homozygous loss-of-function alleles produce no deleterious phenotypes, including some expected to result in genetic disease (

Narasimhan et al., 2016

)

Slide19

Identification of candidate HH2 variant

HH2 identified from a deficiency-of-homozygotes approach and undesirable effects on conception rate and stillbirths confirmed5 carriers were present in a group of 183 sequenced Holstein bulls selected to maximize the coverage of unique haplotypes3 variants concordant with the haplotype calls were found in the HH2 region

A high-impact frameshift in

intraflagellar

protein 80 (

IFT80

) was confirmed in Holsteins from the 1000 Bull Genomes Project that shared no animals with the discovery set

Slide20

Validation of candidate HH2 variant

IFT80-null embryos generated by truncation at exon 2 with guide-RNAs annealed to Cas9 mRNAAbattoir-derived oocytes fertilized in vitro with high-fertility semen

Embryos injected at the one-cell stage with CRISPR-Cas9 complex (treatment) or Cas9 mRNA (control) before return to culture

IFT80

-null embryos arrested at the 8-cell stage of development, consistent with data from mouse hypomorphs and HH2 carrier-to-carrier

matings

Slide21

Efficiency of editing

Procedures similar to Ortega

et al. (2019)

Slide22

HH2 candidate confirmed with functional validation

A frameshift in IFT80 at 107,172,615 bp (p.Leu381fs) disrupts wnt

and

hedgehog

signaling, and is responsible for the death of homozygous embryos

A tag SNP will be used to track the causal mutation

Proven sires could be genotyped to confirm concordance

Control

embryos injected with only Cas-9 (left)

Treatment

embryos injected with Cas-9 and IFT80 exon 2 guide RNA (right)

Slide23

Should carrier bulls be culled?Remove

carrier bulls from the population if population is large enough and non-carrier bulls are availableNon-carrier bulls are as good as carrier bulls, on average


Carriers


Non-carriers


Breed

N

Mean

SD


N

Mean

SD

Difference

P value

AY

16

286.43

194.67


53

272.41

191.69

13.02

0.407

BS

30

223.10

218.39


59

284.19

160.36

-61.09

0.087

HO

550

394.08

216.77


1,765

479.49

213.89

-85.41

<0.001

JE

99

340.51

149.00


378

338.82

153.99

1.69

0.460

Source: Cole et al. (2016).

Slide24

Bull carrier status should be published

Slide25

Include marker information when selecting matesShepherd and

Kinghorn (2001) described a look-ahead mate selection scheme using markers.Li et al. (2006, 2008) showed QTL provide more benefit when used in mate selection rather than in index selection.

Van

Eenennaam

and

Kinghorn

(2014)

proposed selection against the total number of lethal alleles and recessive lethal genotypes.

Cole (2015)

suggested that parent averages can be adjusted to account for genetic load in sequential mate allocation schemes.

Slide26

Can we edit our way around the problem?

Johnsson et al. (2019)

Bastiaansen

et al. (2018)

Mueller et al. (2019)

Slide27

More edits, more problems?

Slide28

ConclusionsMendelian genetic disorders are responsible for

economic losses to dairy farmersAs technology improves we are identifying more recessive defects

CRISPR-Cas9 knockouts can be use for

functional validation

of candidate mutations

Gene editing should be used to

eliminate harmful alleles

from the population

Carrier bulls

should not be used when non-carrier bulls are of comparable genetic merit and bottlenecks may be avoided

Slide29

Acknowledgments

Mr. Kenneth Shallop, and Dr. Steve Schroeder

of AGIL assisted with DNA extraction, sequencing, and alignment of resulting reads.

The Council on Dairy Cattle Breeding (Bowie, MD) provided access to the National Dairy Database for testing fertility effects and identifying candidate HH2 regions.

Access to SNP genotypes and DNA for sequencing was provided by the

Collaborative Dairy DNA Repository

(Verona, WI).

Data from Run 7 of the the

1000 Bull Genomes Project

were used for independent validation of HH2.

Slide30

SupportBickhart

: ARS project 5090-31000-026-00-DBickhart and Cole: AFRI Grant 2016-67015-24886Cole, Hutchison, and Null: ARS project 8042-31000-002-00-DCole and Ortega: NIH and USDA-NIFA Dual-Purpose R01 Grant 4097656USDA is an equal opportunity provider and employer.Mention of trade names or commercial products in this presentation is solely for the purpose of providing specific information and does not imply recommendation or endorsement by the US Department of Agriculture.

Slide31

Questions?

Holstein and Jersey crossbreds graze on American Farm Land Trust’s

Cove Mountain Farm in south-central Pennsylvania

AIP web site:

http

:

/

/

aipl.arsusda.gov

/

Source:

ARS Image Gallery, image #K8587-14; photo by Bob Nichols

Slide32

ReferencesBastiaansen

et al., 2018; PMID: 29661133Cole, 2015; PMID: 26620491Cole and Null, 2019; PMID: 31255269

Cole et al., 2016; PMID: 27394947

Cole et al., 2018;

https://bit.ly/2utjPbT

Derks et al., 2019; PMID: 30875370

Doman et al., 2020; https://

doi.org

/10.1038/s41587-020-0414-6

Fritz et al., 2018; PMID: 29680649

Höijer

et al., 2020, bioRxivJenko

et al., 2019; PMID: 30836944

Johnsson

et al., 2019; PMID: 30995904

Li et al., 2006; PMID: 16492372, 18803790

Slide33

References (cont’d)MacArthur et al., 2012; PMID: 22344438

Medugorac et al., 2011; PMID: 22737241Mueller et al., 2019; PMID: 30852022

Narasimhan et al., 2016; PMID: 26940866

Norris et al., 2020; PMID: 32034391

Ortega et al., 2019; PMID: 31803983

Philipp et al., 2011; PMID: 22174915

Rossi et al., 2015; PMID: 26168398

Shepherd and Kinghorn, 2001; AAABG

Van

Eenennaam

and Kinghorn, 2014; WCGALP

Slide34

References (cont’d)VanRaden

et al., 2011; PMID: 22118103Youngworth and Delany, 2019; PMID: 31075853