/
Lecture 4 – Characters: Molecular Lecture 4 – Characters: Molecular

Lecture 4 – Characters: Molecular - PowerPoint Presentation

Lionheart
Lionheart . @Lionheart
Follow
342 views
Uploaded On 2022-08-03

Lecture 4 – Characters: Molecular - PPT Presentation

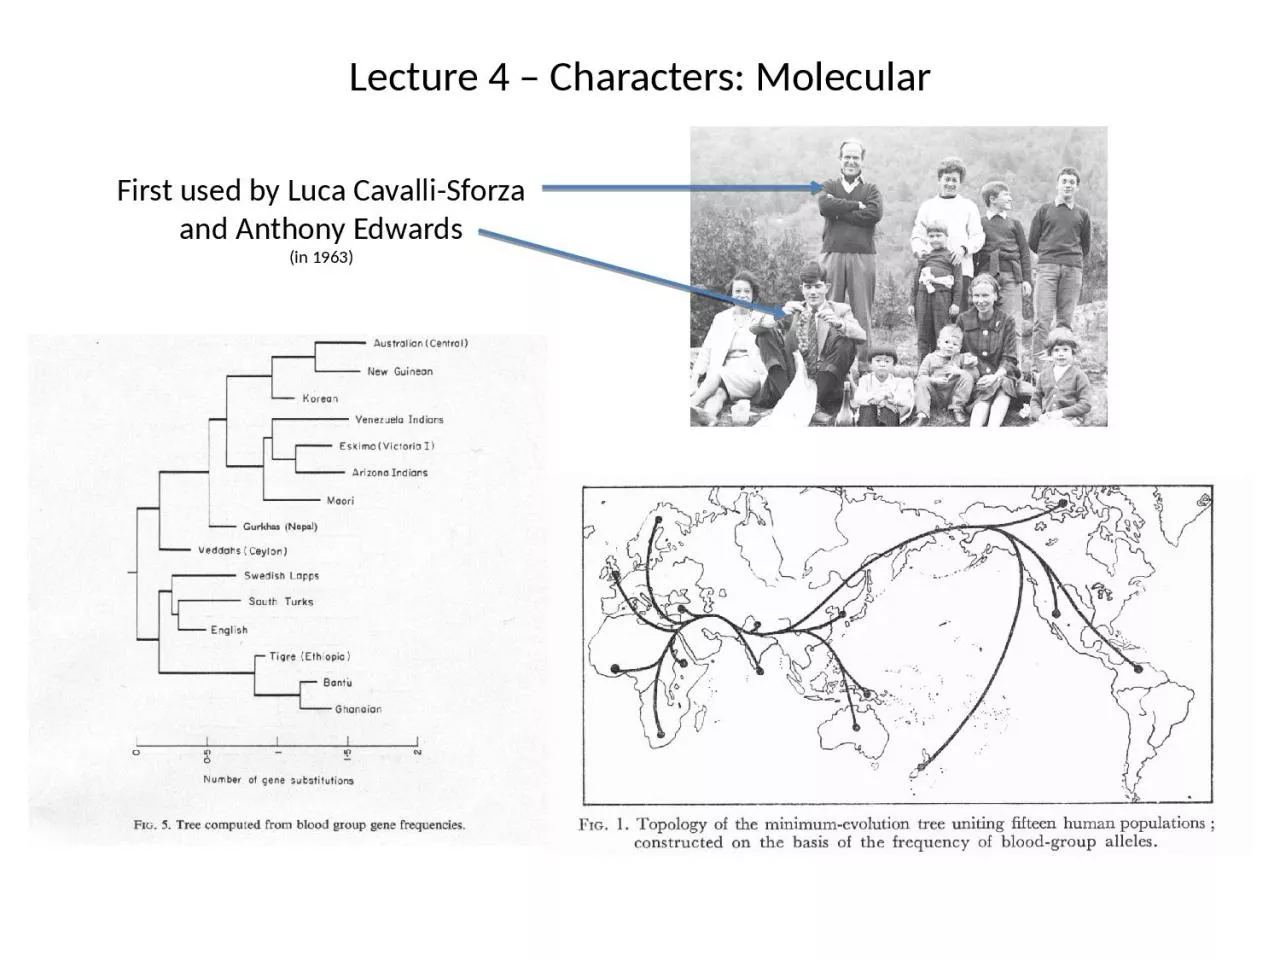
First used by Luca Cavalli Sforza and Anthony Edwards Lecture 4 Characters Molecular   cwk1056 eaa292 cwk1025 eaa448 dsr5032 eaa028 fac1117 cwk1007 cwk1056 ID: 933475

data gene characters distance gene data distance characters words number distances homology word taxon frequency inversions genomic analyses matrix

Share:

Link:

Embed:

Download Presentation from below link

Download Presentation The PPT/PDF document "Lecture 4 – Characters: Molecular" is the property of its rightful owner. Permission is granted to download and print the materials on this web site for personal, non-commercial use only, and to display it on your personal computer provided you do not modify the materials and that you retain all copyright notices contained in the materials. By downloading content from our website, you accept the terms of this agreement.


Presentation Transcript

Slide1

Lecture 4 – Characters: Molecular

First used by Luca

Cavalli

-Sforzaand Anthony Edwards

Slide2

Lecture 4 – Characters: Molecular


cwk1056 eaa292 cwk1025 eaa448 dsr5032 eaa028 fac1117 cwk1007

cwk1056 ---------- eaa292 0.05840708 ----------

cwk1025 0.01769911 0.05398230 ---------- eaa448 0.08672567 0.08141593 0.08230089 ----------dsr5032 0.02566372 0.05929204 0.01946903 0.08495575 ----------

eaa028 0.06725664 0.07433628 0.06371681 0.07522124 0.07168142 ----------fac1117 0.02123894 0.05575221 0.00530973 0.08053097 0.02123894 0.0637168 ----------cwk1007 0.05221239 0.02920354 0.05132743 0.08230089 0.05486726 0.07610620 0.05132743 ----------

eaa667 0.05840708 0.01238938 0.05221239 0.07787611 0.05752213 0.07433628 0.05398230 0.02743363 

Pairwise distance matrix:

(

n

2

-n)/2

The units for these distances vary, but the matrix can then be subjected to a number of potential phylogenetic analyses.

Information regarding comparative genomics may be presented as inherently distance data.

Here, n = 9, so there are 36 pairwise distances.

Slide3

An example of a simple genomic distance.

(Edwards et al. 2002. Syst. Biol. 51:599 )

Large amounts of sequence data that is

assumed to be a random sample from each respective genome.

Begin by calculating the frequency of each of the 4n bp words in each taxon, where

n is the length of the word. n

= 1, there are 4 words: G, A, T, C (data are the base frequencies). n

= 2, there are 16 possible dinucleotide words – 16 frequencies.

Slide4

 Edwards et al. (2002) use 5 bp

words, so there are 45 = 1024 possible words, and the frequency of each word is calculated from the genome sample for each OTU.

So, for each taxon, we have a vector of

penta-nucleotide frequencies.

The Euclidian distance between each pair of genomes is calculated to generate a distance matrix.

where

f

xi

is the frequency of word

x

in taxon

i and fxj

is the frequency of word x in taxon j.

Slide5

This matrix is then subjected to any of a number of tree-estimation methods.

Deep split in bird phylogeny (

Paleognathous

birds) is reflected in the genomic signature.

Slide6

2. Chromosomal Inversions have a long history due to

Diptera

having polytene chromosomes.

Can puzzle out order of inversions, and use events as characters.

Potential Molecular Characters

1. Allozymes – Allelic forms of proteins (usually enzymes) that vary by a

charge changing amino-acid. Distance-based or character-based analyses were conducted.

Slide7

2. Chromosomal Inversions

(

Kamail

et al. 2012.

PLoS

Pathogens)

Slide8

3. Sequence Data

a. Gene sequences – 4 possible character states.

b. Protein sequences - 20 possible character states.

Again, we’ll spend the rest of the semester with these data types.

Slide9

4. Higher order molecular characters

(Rare Genomic Changes)

Rokas

and Holland (2000. TREE, 15:454).

Slide10

a. Insertions/Deletions in/of introns.

These are often applied to already existing phylogenetic hypotheses.

Murphy et al. (2007. Genome Res., 17: 413)

Slide11

Webster &

Littlewood

. 2012. Int. J. Parasit. 42:313-321.

b. Gene-order data

Slide12

c. microRNA (

miRNA) Profile

Tarver et al. (2013. Mol. Biol.

Evol. 30:2369)

Slide13

c. microRNA (miRNA) Profile

Losses are more frequent than reported, there is large heterogeneity in rates of gains and losses, there’s ascertainment bias, and model-based analyses that account for this can refute simple analyses.

Slide14

d. Genomic Distances from Gene Content

Increasingly, gene content data have been applied to the growing database

of prokaryotic genomes.

Some distances are simple comparisons of the number of shared genes:


= the number of genes shared by genomes

and

j.


Other distances try to measure the number of transformations (gene loss, duplications, gene gain via HGT, etc.) required for two genomes to be identical in terms of content.

Slide15

Mutiple

Data Types (

Bochkareva et al. 2018)

Inversions

Nucleotide Sequences

Gene Order

Slide16

A

B

C

Speciation

Speciation

Duplication

a

A

a

C

a

B

a

b

A

b

B

b

C

b

Gene

Homology

Remember that homology is sharing of the same feature due to inheritance from a common ancestor.

For gene families, we specify homology that traces to speciation event to be

orthologous

, and

homology that traces to a gene duplication to be

paralogous

.

A

a

& B

a

are

orthologues.

A

a

&

A

b

are paralogues.