/
Hurricanes, Climate, and Culture: How We Cope with Natural Disasters Hurricanes, Climate, and Culture: How We Cope with Natural Disasters

Hurricanes, Climate, and Culture: How We Cope with Natural Disasters - PowerPoint Presentation

MrRightNow
MrRightNow . @MrRightNow
Follow
342 views
Uploaded On 2022-07-28

Hurricanes, Climate, and Culture: How We Cope with Natural Disasters - PPT Presentation

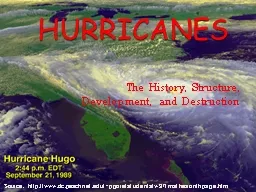
Kerry Emanuel Lorenz Center MIT Walter Orr Roberts 19151990 Dedicated to Science in the Service of Society Program Hurricanes and Hurricane Disasters Hurricane Impacts Societal Response to Hurricanes ID: 930029

august hurricane utc orleans hurricane august orleans utc october climate nagin disasters storm hurricanes katrina surge national landfall sandy

Share:

Link:

Embed:

Download Presentation from below link

Download Presentation The PPT/PDF document "Hurricanes, Climate, and Culture: How We..." is the property of its rightful owner. Permission is granted to download and print the materials on this web site for personal, non-commercial use only, and to display it on your personal computer provided you do not modify the materials and that you retain all copyright notices contained in the materials. By downloading content from our website, you accept the terms of this agreement.


Presentation Transcript

Slide1

Hurricanes, Climate, and Culture: How We Cope with Natural Disasters

Kerry Emanuel

Lorenz Center, MIT

Slide2

Walter Orr Roberts

(1915-1990)

Dedicated to Science in the Service of Society

Slide3

Program

Hurricanes and Hurricane Disasters

Hurricane Impacts

Societal Response to Hurricanes

The Future of Hurricane Disasters

Slide4

The View from Space

Slide5

Igor, 2010

Slide6

Slide7

Slide8

The word

Hurricane

is derived from the Mayan word

Huracan

and the

Taino

and

Carib

word

Hunraken

, a terrible God of Evil, and brought to the West by Spanish explorers

Slide9

God of Winds Temple, Tulum, Mexico13th – 15

th Centuries

Slide10

Slavers throwing overboard the Dead and Dying – Typhoon coming on (‘The Slave Ship’), 1840

– J. M. W. Turner, Museum of Fine Arts, Boston

Slide11

Hurricane Impacts

Slide12

Hurricane Risks:

Wind

Rain

Storm Surge

Slide13

Slide14

The Global Hurricane HazardAbout 10,000 deaths per year since 1971

$700 Billion 2015 U.S. Dollars in Damages Annually since 1971

EM-DAT, 2016: The OFDA/CRED International Disaster Database

http

://www.emdat.be/

.

Slide15

Privately insured… $$$

Publicly

insured…

No $$$

Slide16

Windstorms Account for Bulk of Insured Losses Worldwide

Slide17

Source: Roger Pielke, Jr.

Total U.S. Hurricane Damage by Decade, in 10

10

2004 U.S. Dollars

Slide18

Population of Florida, 1790-2004

Slide19

Source: Roger Pielke, Jr.

Total Adjusted Damage by Decade, in 10

10

2004 U.S. Dollars

Slide20

How Does Society Cope with Hurricanes? Some Examples

Slide21

Deadliest tropical cyclone ever recorded

350,000 – 500,000 lives lost

Led to formation of Bangladesh

Bhola

Cyclone of 1970, East Pakistan

Slide22

Bangladesh currently has > 2,500 cyclone shelters with more under construction. World Bank, NGOs

Slide23

The U.S. Hurricane Problem

Slide24

Case 1: Hurricane KatrinaAugust, 2005

Slide25

Slide26

Katrina was exceptionally well forecast

Forecast from 18 GMT 26 August

Forecast from 18 GMT 27 August

Slide27

Relevant Facts

Excellent forecasts from > 3 days prior to landfall Costliest natural disaster in U.S. history Among the 5 deadliest hurricanes in U.S. history> 1800 deaths

Highest death toll since 1928 Okeechobee Hurricane

> 50 breaches of New Orleans surge protection system

> 80% of city flooded

Total

economic impact in Louisiana and Mississippi may

have exceeded

$150 billion

Slide28

Elements of the Disaster

Slide29

27 August, evening EDT: National Hurricane Center Director Max Mayfield personally calls Louisiana

Governor Blanco and Mississippi Governor Barbour, telling them that Katrina will be a “big, big deal”.

27 August 8 PM EDT: Mayfield has been trying to reach Ray Nagin, mayor of New Orleans, and finally contacts him by routing call through White House. Mayfield asks Nagin to order a mandatory evacuation. Nagin later recalled that Mayfield “scared the crap out of me”. But Nagin orders only a voluntary evacuation and asks his attorneys to look into his legal liability to lawsuits from local businesses.

28 August 0500 UTC: NOAA data buoy 42003, 200 nm west of Naples, FL,

capsizes

after reporting 11

meter significant wave heights.

First

capsizing of a 10-meter buoy in the Gulf

of

Mexico in NDBC's 30-year history of operation

.

28 August 1200 UTC: Katrina upgraded to Category 5. Hurricane warning is issued for north central Gulf Coast including New Orleans

Slide30

28 August 9:30 AM CDT: Mayor Nagin finally issues mandatory evacuation order 28 August 10:10 AM CDT: National Weather Service

New Orleans issues nearly apocalyptic statement:

Most of the area will be uninhabitable for weeks ... perhaps longer. At least one half of well constructed homes will have roof and wall failure. … The majority of industrial buildings will become non functional. … Airborne debris will be widespread and may include heavy items such as household appliances and even light vehicles. … Persons, pets, and livestock exposed to the winds will face certain death if struck. Power outages will last for weeks … water shortages will make human suffering incredible by modern standards.

Slide31

29 August 1110 UTC: Katrina makes landfall near Buras, Louisiana, as a high Category 3 hurricane 29 August, morning CDT: Mayor Nagin abandons post at Emergency Operations Center in favor of the Hyatt hotel, which then loses power, cutting off communications

29 August 1300 CDT: Two major flood-control levees are breached and the National Weather Service reports "total structural failure" in parts of New Orleans. Many are feared

dead

in flooded neighborhoods under as much as 20 feet

of water

29 August, morning: Many New Orleans Police officers abandon duty in favor of evacuating their families. More than 200 are later put on trial

29 August: By evening, 80% of New Orleans is underwater

Slide32

The Aftermath

30 August: New Orleans is left with no power, no drinking water, dwindling food supplies, widespread looting, fires

and

steadily

rising

waters from major levee breaches.

Efforts

to limit the

flooding

are unsuccessful and force

authorities

to try evacuating

the

thousands of people at city shelters Individual acts of heroism and the action of the U.S. Coast Guard and Louisiana Wildlife and Fisheries Department save many FEMA director Michael Brown is virtually missing for several days Politicians begin finger-pointing Cuba and Venezuela offer aid September 1, 2 PM CDT: On national television New Orleans Mayor Ray Nagin issues a "desperate SOS" for help from the federal government 2014: Nagin was convicted on twenty of twenty-one charges of wire fraud, bribery, and money laundering related to bribes from city contractors before and after Hurricane Katrina

and was sentenced to ten years in federal prison

Slide33

Lessons from Katrina Years of planning and excellent forecasts cannot succeed when leadership fails owing to corruption, cowardice, and incompetence

Breakdown of technical and human communication is a major element in many disasters Business interests can trump safety considerations in the lead- up to disasters Short-term rescue and recovery often depends on ad-hoc and creative acts of bravery and spontaneous organization among individuals and organizations with much local knowledge

Local culture is a critical element in preparing for and reacting to natural disasters

Slide34

Is New Orleans Sustainable?

Slide35

Slide36

100 of a set of 3400 tracks affecting New Orleans

Slide37

Slide38

Projections of TC Power at Landfall near New Orleans

RCP 8.5

Slide39

Case 2: Hurricane SandyOctober, 2012

Slide40

Slide41

Sandy made landfall in New Jersey around 00 GMT October 30

Ensemble

forecasts initialized at 1200 UTC 24

Oct (5 ½ days before U.S. landfall)

(Magnusson et al.,

Mon.

Wea

. Rev.

, 2014)

Hard to imagine better track forecasts

Slide42

96-hour forecast by the European Center for Medium-Range Forecasts

Slide43

Relevant Facts

233 fatalities Strongly affected Haiti and Cuba as well as a large swath of the U.S. eastern seaboard $75 billion 2012 U.S. dollars in damage – second costliest hurricane in U.S. history (after Katrina)

While a Category 2 hurricane off the U.S. northeastern coast, Sandy became the largest Atlantic hurricane in history, with a diameter of 1800 km - this contributed to the large magnitude of its storm surge in New York

Governor Andrew Cuomo declared a statewide state of

emergency

and asked for a pre-disaster declaration on

October


26

Slide44

Record 13.88 foot storm surge at the Battery, Manhattan

Worst disaster in the 108-year history of the New York Subway System New York Stock Exchange closed for two days – the first two-day weather closure since the Blizzard of 1888 Over 10 billion gallons of raw and partially treated sewage released in New York and New Jersey

1-3 feet of snow in West Virginia

Slide45

Elements of the Disaster

Slide46

28 October 00 UTC: New York Mayor Michael Bloomberg holds press conference, explaining that he is not ordering any evacuations “based on the nature of the storm….it is not expected to be a tropical storm or hurricane-type surge”

28 October 00-12 UTC: National Hurricane Center Director Richard Knabb has numerous phone conversations with

NYC

Office of

Emergency

Management

29 October, morning EDT: Mayor Bloomberg orders evacuation of Zone A…home to about 375,000 residents, and announces shut-down of entire NYC public transportation system at 7 PM EDT that evening

29 October 12 UTC: Hurricane Sandy reaches second peak intensity of 85 knots, 220 nm southeast of Atlantic City

29 October 21 UTC: NHC advisory continues to emphasize powerful surge threat extending far north of actual storm center

Slide47

29 October 21 UTC: NHC declares that Sandy has become extratropical but continues to issue warnings on storm, including its first ever snowfall advisory (for the mountains of West Virginia)

29 October 2330 UTC: Post-tropical Storm Sandy makes landfall near Brigantine, NJ, with an estimated intensity of 70 kt and a minimum pressure of 945 mb

30 October 00-12 UTC: Record surge arrives in lower Manhattan overtopping seawall at The Battery and flooding parts of the NYC

subway system as well as

the

Hugh

Carey

Tunnel, which links Lower Manhattan and

Brooklyn. Much of lower Manhattan flooded

Slide48

Lessons from Hurricane Sandy

Remarkably good forecasts, excellent communications between forecasters, emergency managers, and political leaders still did not prevent loss of >150 lives Preparations for and reactions to Sandy were by and large greatly superior to those in Katrina

Management of and resilience to natural disasters

strongly

depends on local culture

Much confusion and delayed evacuation resulted from misunderstandings arising from use of multiple and culturally loaded terms such as “hurricane”. Some insurance policies tied to tropical status and/or “named storm” status. Strong impetus for re-visiting warning terminology, storm categorization, and related issues

Slide49

GCM flood height return level, Battery, Manhattan

(assuming SLR of 1 m for the future climate )

Black: Current climate (1981-2000)

Blue: A1B future climate (2081-2100)

Red: A1B future climate (2081-2100) with

R

0

increased by 10% and

R

m

increased by 21%

Lin, N., K. Emanuel, M. Oppenheimer, and E.

Vanmarcke

, 2012: Physically based assessment of hurricane surge threat under climate change.

Nature

Clim

. Change

, doi:10.1038/nclimate1389

Slide50

Population and Climate Change:

The Elephants in the Room

Global population exposed to tropical cyclone hazards has

tripled

since 1970

Sea level is rising and is projected to do so at an accelerating pace through this century

Incidence of intense tropical cyclones is expected to increase

In spite of improving forecasts,

incidence of tropical cyclone disasters will almost certainly rise very substantially

Slide51

Slide52

Why the U.S. Will Have Many More Katrinas and Sandys

Federal and State governments massively subsidize flood risk

National Flood Insurance Program (NFIP) created by Congress in 1968 in response to reluctance of private firms to insure flood risk

Most states heavily regulate property insurance and many restrict premium pricing under pressure from wealthy coastal property owners

NFIP was amended in 2012 by the

Biggart

-Waters Act that changed NFIP

premiums to match actuarial risk-based

premiums. In some areas, premiums rose by a factor of 10

Under pressure from coastal and floodplain property owners, Congress effectively repealed many provisions of

Biggart- Waters with the Homeowner Flood Insurance Affordability Act of 2014

Slide53

Political left emphasizes affordability; means-tested subsidies (such as vouchers) helps those of modest means but inadvertently encourages them to live in risky places (e.g. “FAIR Plan” act of 1968, insurer of last resort)

Political right favors effective subsides for wealthy coastal property owners over free-market principles (FAIR Plan now covers most wealthy coastal property owners in Massachusetts) Net result is massive publicly financed incentives to live and build in risky locations

We can predict with confidence that U.S. coastal hurricane-related losses will increase over time, exacerbated by sea level rise and, possibly, by increases in hurricane risk itself

Slide54

Projections of U.S. Hurricane Landfall Power from 6 CMIP5 models

Slide55

From:

American Climate Prospectus Economic Risks in the United States

Sea level rise alone

Sea level rise + changing storms

Slide56

Summary

Hurricanes take 10,000 lives and cost $700 billion annually

Response to actual and perceived hurricane threats highly dependent on local and national culture

Greatly increasing coastal population coupled with rising sea levels and, possibly, increases in frequency of intense storms portend ever increasing damage and mortality from hurricanes

Slide57

Summary

These trends make it urgent to revisit and reform hurricane-related policies

Adaptation pathways depend on location, long-term vs short-term viewpoints, and assumed discount rates

Hurricanes are just one among many climate hazards we must mitigate or adapt to