/
Characterization Methods for Structure-Property Relationships in Clinical Formulations Characterization Methods for Structure-Property Relationships in Clinical Formulations

Characterization Methods for Structure-Property Relationships in Clinical Formulations - PowerPoint Presentation

PrincessPeach
PrincessPeach . @PrincessPeach
Follow
343 views
Uploaded On 2022-08-03

Characterization Methods for Structure-Property Relationships in Clinical Formulations - PPT Presentation

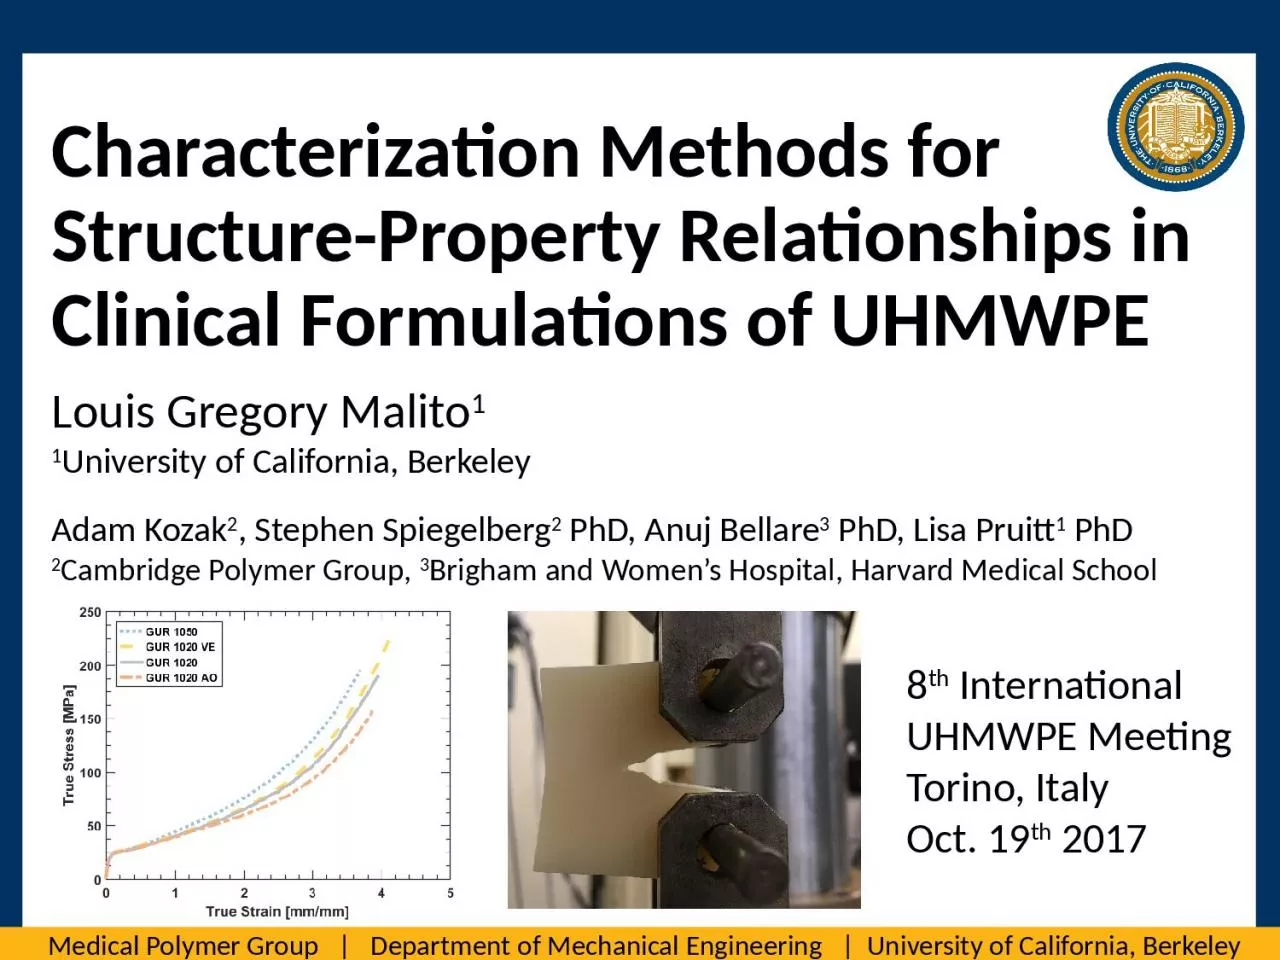
Louis Gregory Malito 1 1 University of California Berkeley Adam Kozak 2 Stephen Spiegelberg 2 PhD Anuj Bellare 3 PhD Lisa Pruitt 1 PhD 2 Cambridge Polymer Group 3 Brigham and Womens Hospital Harvard Medical School ID: 933295

stress amp strain uhmwpe amp stress uhmwpe strain true tensile material mpa biomaterials properties astm tut flow rimnac toughness

Share:

Link:

Embed:

Download Presentation from below link

Download Presentation The PPT/PDF document "Characterization Methods for Structure-P..." is the property of its rightful owner. Permission is granted to download and print the materials on this web site for personal, non-commercial use only, and to display it on your personal computer provided you do not modify the materials and that you retain all copyright notices contained in the materials. By downloading content from our website, you accept the terms of this agreement.


Presentation Transcript

Slide1

Characterization Methods for Structure-Property Relationships in Clinical Formulations of UHMWPE

Louis Gregory Malito11University of California, BerkeleyAdam Kozak2, Stephen Spiegelberg2 PhD, Anuj Bellare3 PhD, Lisa Pruitt1 PhD2Cambridge Polymer Group, 3Brigham and Women’s Hospital, Harvard Medical School

8th International UHMWPE MeetingTorino, Italy Oct. 19th 2017

Slide2

Motivation

900,000 TJR annually in U.S. and majority utilize UHMWPE.

Simple mechanical characterization methods are needed for material comparisons and retrieval analysis.

Numerous clinical formulations of UHMWPE in varying crosslink dose, thermal treatment and antioxidant

chemistry.

Total Knee Replacement

Total Shoulder Replacement

healthbase.com

,, springerimages.com

Total Hip Replacement

Slide3

Motivation

What are the Elastic properties of UHMWPE?What are the post yield properties of UHMWPE?What are the fracture toughness properties of UHMWPE?E = 117 to 2020 MPa?


Ultimate Tensile Stress = 33 to 200 MPa

= (

+ UTS)/

2


(

Kurtz et al. Biomaterials 1998)

(

Gomoll

et al. JORS 2002

)

(Bergstrom et al., 2003 Biomaterials)

(Oral et al., 2006 Biomaterials)

(Atwood et al., 2011 JMBBM

)

(

Bellare

et al. JMBBM 2016

)

(Ansari et al. JMBBM 2016)

(J-R power law fit)

(Blunting line)

Intersection of J-R curve and

Blunting line is JIC .


(

Anderson Fracture Mechanics)

Slide4

2 resins (1020/1050)

Range of crosslinking

(Doses: 35-125 kGy)2 antioxidants:

AO and VE

Slide5

Methods: Tensile Testing (Engineering)

ASTM D638 Type IV tensile specimens (n=5) @ 25°C50 mm/min disp rateFracture properties depend on Engineering Ultimate Stress(Kurtz et al., 1998 Biomaterials) (Rimnac

et al., 1988 PES)


GUR 1020

Slide6

Methods: Tensile Testing (True)

ASTM D638 Type IV tensile specimens (n=5) @ 25°C, 50mm/min disp rate.Dual video extensometer for true stress-strain.0.2% offset yield for comparison to compression

(Kurtz et al., 1998 Biomaterials)(Kurtz et al., 2002 Biomaterials)(Kurtz et al., 2006 Biomaterials)(Rimnac et al., 1988 PES)


GUR 1020

Slide7

Methods: Fracture Toughness

J-R curves using ASTM D6068 and E1820. 1mm/min displacement rate @25°C.C(T) specimens W=31.75mm, B=15.9mm

EUTS

= (

+ UTS)/2


(Paris 1979 ASTM)


Slide8

Methods: Microstructure


Crystallinity (

X

C

) through DSC ASTM F2625.

Inter-lamellar spacing (

L

), lamellar thickness (

D

), amorphous thickness (

A

), and specific internal surface (

O

ac

) from from SAXS.

Pearson and Spearman correlation with mechanical properties (median values) to determine relationship between microstructure and bulk properties.


(Atwood et al., 2011 JMBBM)

(

Turell

&

Bellare

2004 Biomaterials)

Slide9

Results: Tensile Stress Strain

Linear regression from 0.0005 to 0.009 true strain produces largest difference between moduli of UHMWPE material formulations.Highest R2 values produced this way (0.95-0.99).Relative STD is not increased using this method.(Oral et al., 2006 Biomaterials)(Atwood et al., 2011 JMBBM)

Method can elucidate or hide material properties!!!

Slide10

True Ultimate Tensile Stress decreases with cross-linking dosage in each material group.

True Ultimate Tensile Strain

decreases with cross-linking dosage in each material group

.

Energetic Toughness (

ET

)

decreases with cross-linking dosage in each material group.

Slide11

Results: Fracture Toughness

E = 865.4 MPa 14.1 MPa

EUTS = 49.4 MPa


E = 865.4 MPa

14.1 MPa

TUTS = 158.8 MPa

= 86.5 MPa


(

Rimnac

et al., 1988 PES)

(Pascaud et al., 1997 PES)

(ASTM E1820)


Slide12

Results: Fracture Toughness

Tearing Modulus (T) (Flow=Metal), no real change between blendsKJIC (Flow=Metal) ranges between 4.4 to 5.7 MPa√mVaradarajan and

Rimnac found differences of -45% to -30% between JminQ from CTOD versus JQ from blunting line for cross-linked UHMWPE

(Varadarajan & Rimnac 2008 Polymer)


It’s all about the METHOD!

Slide13

Results: Microstructure & Correlations

& TUT Stress

= 0.628 & TUT Strain

 = 0.8

ET

= 0.78

A

& TUT Strain

 = 0.601L & EUT Stress

 = 0.67

D & EUT Stress

 = 0.64

= 0.628

= 0.8

= 0.78

A

&

TUT Strain

= 0.601

L

&

EUT Stress  = 0.67

D & EUT Stress = 0.64Spearman Rank Correlation from 45.6 – 52.9% across material formulationsD from 21.3 – 25.9nm across material formulations (Atwood et al., 2011 JMBBM) & KJIC (Flow=Metal)

 = 0.912

&

dJ

/d

Δ

a

= 0.946

EY Stress

&

K

JIC

(Flow=Metal)

= 0.943

= 0.912

= 0.946

EY Stress

&

K

JIC

(Flow=Metal)

= 0.943

Pearson Correlation Coefficient

Spearman Rank Correlation

p

≤ 0.05 (all correlations using median values)

Slide14

Mechanical testing of UHMWPE needs to be standardized as method can elucidate or hide material properties.

Linear regression from 0.0005 to 0.009 true axial strain, from true stress-strain data offers the best method of analyzing elastic modulus.Multi-specimen J-R data passes validity criteria.Using EUTS as can over exaggerate JIC and KJIC , more conservative to use True Ultimate Tensile (TUT) Stress with ASTM E1820 flow stress. Using true data with E1820 approach comparable to previous findings with CTOD.

correlate with TUT Stress, TUT strain, ET, and dJ/dΔa.D and EY Stress was found to correlate to

KJIC (Flow=Metal) implying that altering the crystalline phase of UHMWPE can increase fracture toughness.


Conclusions

(

Varadarajan

& Rimnac 2008 Polymer)

Slide15

We would like to thank Orthoplastics, Quadrant and DePuy for supplying

materialsFunding for this research was provided by the Lawrence Talbot Professorship endowment, and the Ian Finnie graduate mechanical behavior of engineering materials fellowship.Acknowledgements