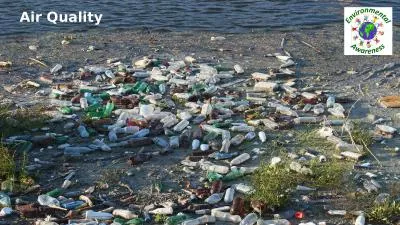
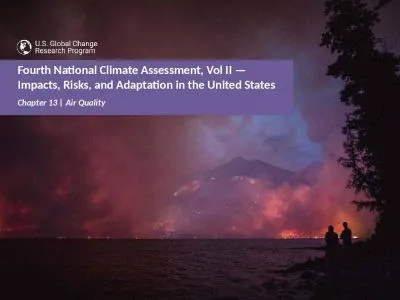
Juan Aguilera MD PhD MPH University of Texas at El Paso jaaguilera2utepedu 1 915 2743475 The author declares that there is no conflict of interest Lecture Tracks HTTT Healthrelated concerns of air pollution originated from events in ID: 935020
Download Presentation The PPT/PDF document "www.carteeh.org Lecture #4: Air Quality ..." is the property of its rightful owner. Permission is granted to download and print the materials on this web site for personal, non-commercial use only, and to display it on your personal computer provided you do not modify the materials and that you retain all copyright notices contained in the materials. By downloading content from our website, you accept the terms of this agreement.
Slide1
www.carteeh.org
Slide2Lecture #4: Air Quality Standards and Health
Juan Aguilera
MD, PhD, MPH
University of Texas at El Paso
jaaguilera2@utep.edu
+1 (915) 274-3475
The author declares that there is no conflict of interest
Lecture Track(s): HT/TT
Slide3Health-related concerns of air pollution originated from events in1Belgium (1930)Pennsylvania (1948)London (1952)
https://www.youtube.com/watch?v=SXGakIQSOn0
The Clean Air Act (CAA) of 1970 mandates the U.S. Environmental Protection Agency (EPA) to set health-based National Ambient Air Quality Standards (NAAQS) for certain (criteria) pollutants that are known hazards to human health
1-5
Introduction
Research
US Public Policy
1930s – 1950s: Studies of early episodes of air pollution1955, 1963: Early national legislation1967, 1970, 1971: Clean Air Act, National Ambient Air Quality Standards1960s – 1980s: Scattered ecologic and other studies; inhalation toxicologic studies1987: PM10 standards for particulate matter air pollution established replacing previous standards for total suspended particulate matter1989 – 1995: Reports of several key, loosely connected research efforts1997: Promulgation of PM2.5 standards1995 – 2004: Controversy regarding health effects of low-level air pollution, reanalysis of key studies; rapid growth in epidemiologic, toxicologic an other studies1998 – 2001: PM2.5 standard challenged, blocked in federal appeals court, but ultimately upheld by Supreme Court2002 – 2004: Additional review of PM2.5 standards; cost-benefit analysis
Adapted from Pope (2004)
Slide4Air quality standards are set to protect public health to avoid unacceptable risksThe NAAQS requires the protection of both general and sensitive populations
6
Health impact assessments rely on prospectively modeled air quality predictions under broadly-defined hypothetical scenarios
7-8
Definitions and rationale of air quality standards
Slide5Air pollution is an important risk factor for various adverse health effects in humansMany studies have focused on respiratory disease, but substantial evidence indicates air pollution is also a risk for cardiovascular disease 1,9-14
Respiratory and cardiovascular health effects
https://publichealthmatters.blog.gov.uk/2018/11/14/health-matters-air-pollution-sources-impacts-and-actions/
Slide6NAAQS criteria pollutants15 particulate matterozone
sulfur dioxide
nitrogen dioxide
carbon monoxide
lead
Defined as those widespread & originated from multiple sources that endanger human healthPollutants should go under scientific review every five years
Criteria pollutants
http://www.alamoareampo.org/AirQuality/standards.html
Slide7Particle pollution includesPM
10
: diameters 10 micrometers and smaller
PM
2.5
: diameters that are 2.5 micrometers and smallerHealth effects16
Respiratory symptoms irritation of the airways coughing
difficulty breathingaggravated asthmaCardiovascular symptomsIncreased blood pressureirregular heartbeatnonfatal heart attacksParticulate Matterhttps://www.jagranjosh.com/general-knowledge/what-is-pm-25-and-pm10-and-how-they-affect-health-1528711006-1
Slide8Ground-level ozone is created by chemical reactions between oxides of nitrogen (NOx) and volatile organic compounds (VOC)
17
Health effects
17
Irritated mucous membranes
throat irritationc
oughing, wheezingchest pain
airway inflammationOzonehttp://apesairpollution.weebly.com/ground-level-vs-stratospheric-ozone.html
Slide9Primarily gets in the air from the burning of fuels
Health effects
18
S
hort exposure periods
aggravate respiratory diseases (asthma)
coughing, wheezing or difficulty breathing
hospital admissionsLong term exposureincrease susceptibility to respiratory and cardiovascular infectionsNitrogen Dioxidehttps://www.mann-hummel.com/en/research-and-development/future-trends/nitrogen-oxides-harmful-gases-in-the-air/
Slide10Largest sources of SO
2
emissions are from fossil fuels at industrial facilities
19
Health effects
19Difficulty breathing (specially in people with asthma)
Other vulnerable groups include19ElderlyThose with lung diseaseChildren
Sulphur dioxidehttps://www.epa.vic.gov.au/for-community/environmental-information/air-quality/sulfur-dioxide-in-the-air
Slide11Harmful when inhaled in large amounts
Health effects
20
R
educes the amount of oxygen that can be
transported in the blood
Headache, dizzinessVisual problemsMuscle weakness and crampsMore concerning in people with preexisting respiratory or cardiovascular disease
Carbon Monoxidehttp://www.alamoareampo.org/AirQuality/standards.html
Slide12Lead distributes throughout the body in the blood and is accumulated in the bones
21
Health effects
21
a
ffects nervous system
reduced
kidney functioncompromised immune systemDevelopmental and reproductive problemsLong term effects in children and pregnant womenLeadhttps://greenkidsdoc.files.wordpress.com/2015/03/blog-health-effects1.jpg
Slide13Hazardous air pollutants
are known or suspected to cause cancer or other serious health effects
22
EPA is working with state, local, and tribal governments to reduce air emissions of
187 toxic air pollutants
to the environment
22
Examples of toxic air pollutants includebenzeneperchloroethylenemethylene chlorideNon-criteria pollutants
Slide14The Clean Air Act identifies two types of national ambient air quality standards
23
Primary standards provide public health protection, including vulnerable populations
Secondary standards provide public welfare protection
Air quality standards
Pollutant
Primary/SecondaryAveraging TimeLevelForm
Carbon Monoxide (CO)
primary
8 hours
9 ppm
Not to be exceeded more than once per year
1 hour
35 ppm
Lead (Pb)
primary and
secondary
Rolling 3 month average
0.15 μ
g/m
3
Not to be exceeded
Nitrogen Dioxide (NO
2
)
primary
1 hour
100 ppb
98th percentile of 1-hour daily maximum concentrations, averaged over 3 years
primary and
secondary
1 year
53 ppb
Annual Mean
Ozone (O
3
)
primary and
secondary
8 hours
0.070 ppm
Annual fourth-highest daily maximum 8-hour concentration, averaged over 3 years
Particle Pollution (PM)
PM
2.5
primary
1 year
12.0 μ
g/m
3
annual mean, averaged over 3 years
secondary
1 year
15.0 μ
g/m
3
annual mean, averaged over 3 years
primary and
secondary
24 hours
35 μ
g/m
3
98th percentile, averaged over 3 years
PM
10
primary and
secondary
24 hours
150 μ
g/m
3
Not to be exceeded more than once per year on average over 3 years
Sulfur Dioxide (SO
2
)
primary
1 hour
75 ppb
99th percentile of 1-hour daily maximum concentrations, averaged over 3 years
secondary
3 hours
0.5 ppm
Not to be exceeded more than once per year
Slide15Each country defines its own Air Quality Index (AQI) and its calculation procedure
24-25
The following table summarizes some of the AQIs used around the world
24
Air quality standards across the world
Country
Pollutants Considered
AQI ScaleDescriptionUnited States:Air Quality IndexOzone (O3)Particulate matter (PM10)Carbon monoxide (CO)Sulfur dioxide (SO2)Nitrogen dioxide (NO2)0 to 5000-50 Good
51-100 Moderate
101-150 Unhealthy for Sensitive Groups
151-200 Unhealthy
201-300 Very Unhealthy
301-500 Hazardous
Canada:
Air Quality Health Index
Nitrogen dioxide (NO2)
Ground-level Ozone (O3)
Total particulate (PM2.5 / PM10)
0 to 10+
1-3 Low Risk
4-6 Moderate Risk
7-10 High Risk
10+ Very High Risk
European Union:
Common Air Quality Index
Particulate matter (PM10)
Nitrogen
dioxide
(NO2)
Ozone (O3)
0 to 100+
0-25 Very low
25-50 Low
50-75 Medium
75-100 High
100+ Very High
China:
Air Quality Index
Sulfur dioxide (SO2)
Nitrogen dioxide (NO2)
Coarse Particulate Matter (PM10)
Fine Particulate Matter (PM2.5)
Carbon
monoxide
(CO)
Ozone (O3)
0 to 300+
0-50 Excellent
51-100 Good
101-150 Lightly Polluted
151-200 Moderately Polluted
201-300 Heavily Polluted
300+ Severely Polluted
India:
National Air Quality Index
Coarse Particulate Matter (PM10)
Fine Particulate Matter (PM2.5)
Nitrogen dioxide (NO2)
Sulphur dioxide (SO2)
Carbon monoxide (CO)
Ozone (O3)
Ammonia (NH3)
Lead (Pb)
0 to 500
0-50 Good
51-100 Satisfactory
101-200 Moderately Polluted
201-300 Poor
301-400 Very poor
401-500 Severe
Mexico:
Metropolitan Index of Air Quality
Ozone (O3)
Sulphur dioxide (SO2)
Nitrogen dioxide (NO2)
Carbon monoxide (CO)
Total particulate (PM2.5 / PM10)
0 to 200+
0-50 Good
51-100 Regular
101-150 Bad
151-200 Very Bad
200+ Extremely Bad
Slide16Even at relatively low concentrations, the health effects of air pollution are of great concern26Air pollutants contribute to heart or lung disease, irregular heartbeat, aggravated asthma, decreased lung function, and increased respiratory symptoms27-28 Several reviews summarize the associations of air pollution with diabetes, asthma, emergency room visits, blood pressure and cardiovascular disease
29-32
Health effects at exposure levels below current air quality standards
Slide17Outdoor air pollution leads to 3.3 million premature deaths per year worldwide with important contributions in the U.S from power generation and traffic33In an urban environment, traffic air pollutants originate from the emissions of motor vehicles, wear of vehicle components such as brakes and tires, and suspension of road dust34
Those who are more likely to be affected by excessive levels of air pollutants include people with asthma, lower income, and those living close to heavy traffic roads
35-36
Underlying evidence base
Slide18The CAA requires periodic review of the science upon which the standards are based and the standards themselves23
Planning
Integrated Science Assessment (ISA)
Risk/Exposure Assessment (REA)
Policy Assessment (PA)
Rulemaking
Scientific review during the development of these documents is thorough and extensive. Drafts of all documents are reviewed, and the public has an opportunity to comment on them
23Development and revision of air quality standards
Slide19Compliance monitoring is one of the key components EPA uses to ensure that the regulated community obeys environmental laws and regulations and include
37
formulation and implementation of compliance monitoring strategies
on-site compliance monitoring
inspections, evaluations, and investigations
off-site compliance monitoring
data collection, review, reporting, program coordination, oversight, and support
inspector training, credentialing, and supportCompliance monitoring
Slide20The noncompliance penalty provision requires EPA to assess and collect a noncompliance penalty against three stationary source categories37Major sources
Sources not in compliance with an emission limitation or standard
Sources subject to a nonferrous smelter order, or other order of consent decree
Noncompliance penalty
37
Within 45 days of receipt of a notice, a source must do one of two things: calculate the amount of the noncompliance and submit to EPA the calculation, a proposed payment schedule, and necessary information for independent verification of the penalty calculationOr file a petition for reconsideration challenging the finding of a violation
Non-compliance
Slide21Many studies have focused on respiratory diseases, however substantial evidence indicates air pollution as a risk factor for cardiovascular disease38Criteria air pollutants are monitored under the under NAAQS. However, t
here are other air pollutants
which
are known or suspected to cause serious health effects
22
Air quality standards and compliance monitoring are crucial to decrease the exposure to air pollution37
Discussion
Slide22Additional research is required to understand the biologic mechanisms that link exposure to air pollutants with increases in morbidity and mortality from cardiopulmonary causesRecent studies suggest mechanistic pathways probably include39-41pulmonary and systemic oxidative stress and inflammation
enhanced initiation and progression of atherosclerosis
altered cardiac autonomic function
Research Gaps and Future Directions
Slide23The control of air pollution represents an important opportunity to prevent diseaseAir pollution is a risk factor for pulmonary and cardiovascular diseaseDecreasing air pollution offers substantial opportunities for disease preventionContinued efforts to improve our air quality are likely to provide additional health benefits
Take-Home Messages
Slide24CAA: Clean Air Act CASAC: Clean Air Scientific Advisory CommitteeCO: Carbon Monoxide
EPA: Environmental Protection Agency
NAAQS: National Ambient Air Quality Standards
NO
2
: Nitrogen DioxideO3: OzonePM: Particulate Matter
PM10: inhalable particles, with diameters that are generally 10 micrometers and smallerPM2.5
: fine inhalable particles, with diameters that are generally 2.5 micrometers and smallerSO2: Sulfur DioxideList of Abbreviations
Slide251. Pope CA III, 2000. Epidemiology of fine particulate air pollution and human health: biologic mechanisms and who’s at risk? Environ Health
Perspect
, 108:Suppl 4, pp.713-23.
2. Lave LB,
Seskin
EP, 1970. Air pollution and human health. Science, 169, pp.723-33.
3. Pope CA III, 1989. Respiratory disease associated with community air pollution and a steel mill, Utah Valley. Am J Public Health, 79, pp.623-8.
4. Schwartz J, Dockery DW, 1992. Increased mortality in Philadelphia associated with daily air pollution concentrations. Am Rev Respir Dis, 145, pp.600-4.5. Dockery DW, Pope CA III, Xu X, et al, 1993. An association between air pollution and mortality in six U.S. cities. N Engl J Med, 329, pp.1753-9.6. National Air Quality Standards Act, 1970)7. Bennear Lori Snyder, Coglianese Cary, 2005. Measuring Progress: Program Evaluation of Environmental Policies. Environment: Science and Policy for Sustainable Development, 47, pp. 22–39.8. Zigler Corwin Matthew, Dominici Francesca, 2014. Point: Clarifying Policy Evidence With Potential-Outcomes Thinking Beyond Exposure-Response Estimation in Air Pollution Epidemiology. American Journal of Epidemiology, 180, pp.1133–1140.9. Pope CA III, Thun MJ, Namboodiri MM, et al, 1995. Particulate air pollution as a predictor of mortality in a prospective study of US adults. Am J Respir Crit
Care Med,151, pp.669-74.
10. Brook RD, Franklin B, Cascio W, et al, 2004. Air pollution and cardiovascular disease: a statement for healthcare professionals from the Expert Panel on Population and Prevention Science of the American Heart Association. Circulation, 109, pp.2655-71.
11. Clancy L, Goodman P, Sinclair H, Dockery DW, 2002. Effect of air-pollution control on death rates in Dublin, Ireland: an intervention study. Lancet, 360, pp.1210-4.
12. Hoek G,
Brunekreef
B,
Goldbohm
S, Fischer P, van den Brandt PA, 2002. Association between mortality and indicators of traffic-related air pollution in the Netherlands: a cohort study. Lancet, 360, pp.1203-9.
13. Pope CA III, Burnett RT, Thun MJ, et al, 2002. Lung cancer, cardiopulmonary mortality, and long-term exposure to fine particulate air pollution. JAMA, 287, pp.1132-41.
14.
Gauderman
WJ,
Avol
E, Gilliland F, et al, 2004. The effect of air pollution on lung development from 10 to 18 years of age. N
Engl
J Med, 351, pp.1057-67.
15. Environmental Protection Agency, 2018. Criteria Air Pollutants. Retrieved August 13, 2020, from https://www.epa.gov/criteria-air-pollutants
16. Environmental Protection Agency, 2018. Particulate Matter (PM) Basics. Retrieved August 13, 2020, from https://www.epa.gov/pm-pollution/particulate-matter-pm-basics
17. Environmental Protection Agency, 2020. Ground-level Ozone Basics. Retrieved August 13, 2020, from https://www.epa.gov/ground-level-ozone-pollution/ground-level-ozone-basics
18. Environmental Protection Agency, 2016. Basic Information about NO2. Retrieved August 13, 2020, from https://www.epa.gov/no2-pollution/basic-information-about-no2
19. Environmental Protection Agency, 2019. Sulfur Dioxide Basics. Retrieved August 14, 2020, from
https://www.epa.gov/so2-pollution/sulfur-dioxide-basics
20. Environmental Protection Agency, 2016. Basic Information about Carbon Monoxide (CO) Outdoor Air Pollution. Retrieved August 14, 2020, from
https://www.epa.gov/co-pollution/basic-information-about-carbon-monoxide-co-outdoor-air-pollution
21.Environmental Protection Agency, 2017. Basic Information about Lead Air Pollution. Retrieved August 14, 2020, from https://www.epa.gov/lead-air-pollution/basic-information-about-lead-air-pollution
References
Slide2622. Environmental Protection Agency, 2018. Hazardous Air Pollutants. Retrieved August 13, 2020, from https://www.epa.gov/haps
23. Environmental Protection Agency, 2017. Clean Air Act Text. Retrieved August 14, 2020, from https://www.epa.gov/clean-air-act-overview/clean-air-act-text
24.
Dominici
, 2010)
25. Watson, A. Y., Bates, R. R., & Kennedy, D. (1988). Assessment of human exposure to air pollution: methods, measurements, and models. In Air pollution, the automobile, and public health. National Academies Press (US).
26. Kim, K.-H., Kabir, E. & Kabir, S. 2015. A review on the human health impact of airborne particulate matter. Environment international, 74, 136–143.
27. Atkinson, R. W., Fuller, G. W., Anderson, H. R., Harrison, R. M. & Armstrong, B. 2010. Urban ambient particle metrics and health: a time-series analysis. Epidemiology, 21, 501-511.28. Cadelis, G., Tourres, R. & Molinie, J. 2014. Short-term effects of the particulate pollutants contained in Saharan dust on the visits of children to the emergency department due to asthmatic conditions in Guadeloupe (French Archipelago of the Caribbean). PloS one, 9, e91136.29. Eze, I. C., Hemkens, L. G., Bucher, H. C., Hoffmann, B., Schindler, C., Künzli, N., Schikowski, T. & Probst-
Hensch
, N. M. 2015. Association between ambient air pollution and diabetes mellitus in Europe and North America: systematic review and meta-analysis. Environmental health perspectives, 123, 381-389.
30. Zheng, X.-Y., Ding, H., Jiang, L.-N., Chen, S.-W., Zheng, J.-P.,
Qiu
, M., Zhou, Y.-X., Chen, Q. & Guan, W.-J. 2015. Association between air pollutants and asthma emergency room visits and hospital admissions in time series studies: a systematic review and meta-analysis.
PloS
one, 10, e0138146.
31.
Giorgini
, P., Di
Giosia
, P., Grassi, D.,
Rubenfire
, M., D Brook, R. &
Ferri
, C. 2016. Air pollution exposure and blood pressure: an updated review of the literature. Current pharmaceutical design, 22, 28-51.
32. Franklin, B. A., Brook, R. & Pope III, C. A. 2015. Air pollution and cardiovascular disease. Current problems in cardiology, 40, 207-238.
33.
Lelieveld
, J., Evans, J. S.,
Fnais
, M.,
Giannadaki
, D. &
Pozzer
, A. 2015. The contribution of outdoor air pollution sources to premature mortality on a global scale. Nature, 525, 367-371.
34.
Kok
, T. M. C. M. D.,
Driece
, H. A. L.,
Hogervorst
, J. G. F. &
Briedé
, J. J. 2006. Toxicological assessment of ambient and traffic-related particulate matter: A review of recent studies. Mutation research, 613, 103–122.
35. Alexis, N. E., Huang, Y. C. T.,
Rappold
, A. G.,
Kehrl
, H., Devlin, R. &
Peden
, A. D. B. 2014. Patients with Asthma Demonstrate Airway Inflammation after Exposure to Concentrated Ambient Particulate Matter.
36.
Makri
, A. &
Stilianakis
, N. I. 2008. Vulnerability to air pollution health effects. International journal of hygiene and environmental health, 211, 326-336.
37. Environmental Protection Agency, 2019. National Emission Standards for Hazardous Air Pollutants Compliance Monitoring. Retrieved August 14, 2020, from https://www.epa.gov/compliance/national-emission-standards-hazardous-air-pollutants-compliance-monitoring
38. Han, X. &
Naeher
, L. P. 2006. A review of traffic-related air pollution exposure assessment studies in the developing world. Environment international, 32, 106–120.
39. Lawal, A. O. (2017). Air particulate matter induced oxidative stress and inflammation in cardiovascular disease and atherosclerosis: The role of Nrf2 and
AhR
-mediated pathways. Toxicology letters, 270, 88-95.
40. Kelly, F. J., &
Fussell
, J. C. (2017). Role of oxidative stress in cardiovascular disease outcomes following exposure to ambient air pollution. Free Radical Biology and Medicine, 110, 345-367.
41. Al-
Kindi
, S. G., Brook, R. D., Biswal, S., & Rajagopalan, S. (2020). Environmental determinants of cardiovascular disease: lessons learned from air pollution. Nature Reviews Cardiology, 1-17.
References
Slide27Air Topics - Environmental Protection Agencyhttps://www.epa.gov/environmental-topics/air-topics
Air Quality
- Centers for Disease Control and Prevention
https://www.cdc.gov/air/default.htm
Air Pollution - World Health Organization
https://www.who.int/health-topics/air-pollution
Reading List
Slide28“The author acknowledges Dr. Wen-Whai Li from the University of Texas at El Paso for his guidance and contributions to this presentation”
“The author acknowledges materials adapted from several published documents available on the EPA website. The information provided in this presentation is designed solely for discussion and should not be cited or reproduced for any other uses”
“The author acknowledges tha
t
a
ll images in this presentation are the property of their respective authors and are used for educational purposes”
Acknowledgements