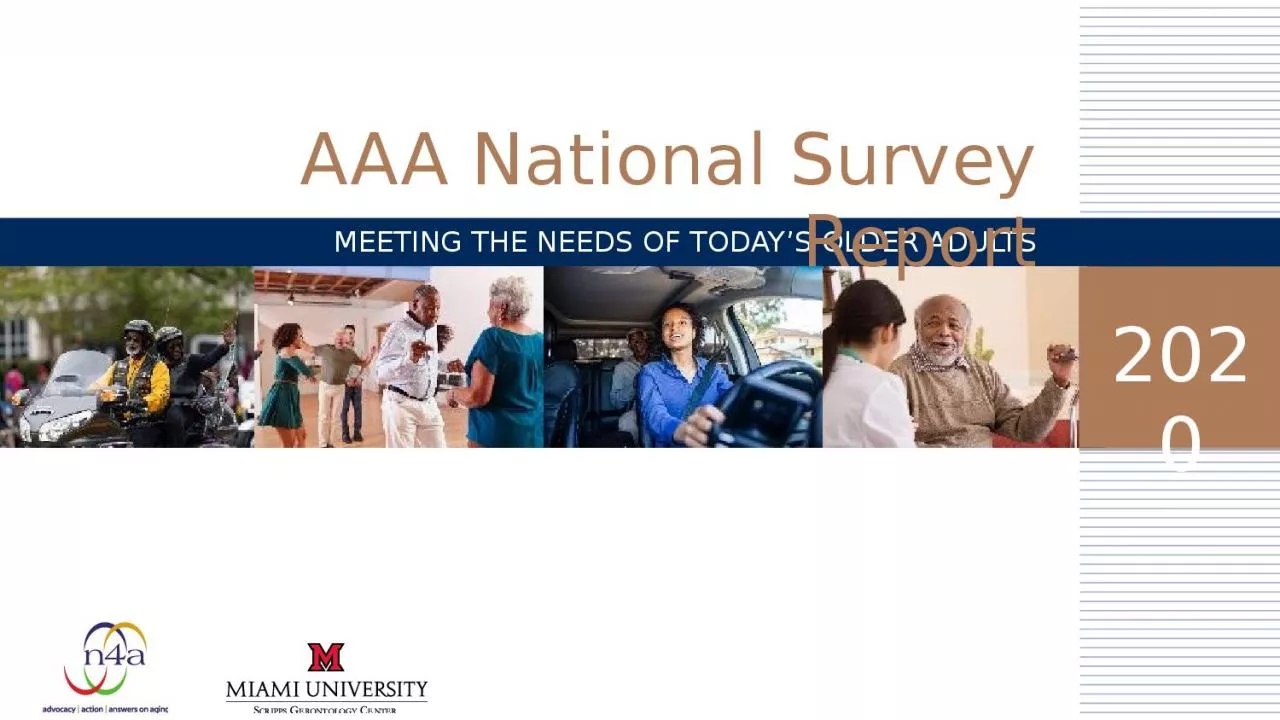
/
MEETING THE NEEDS OF TODAY’S OLDER ADULTS MEETING THE NEEDS OF TODAY’S OLDER ADULTS

MEETING THE NEEDS OF TODAY’S OLDER ADULTS - PowerPoint Presentation

TootsieWootsie
TootsieWootsie . @TootsieWootsie
Follow
345 views
Uploaded On 2022-08-04

MEETING THE NEEDS OF TODAY’S OLDER ADULTS - PPT Presentation

2020 AAA National Survey Report Conducted every three years since 2008 with funding through US Administration on Aging Snapshot of the evolving AAA role in the planning development coordination and delivery of aging and other home and communitybased services ID: 935405

services health older aaas health services aaas older adults care community funding aaa service https housing americans programs www

Share:

Link:

Embed:

Download Presentation from below link

Download Presentation The PPT/PDF document "MEETING THE NEEDS OF TODAY’S OLDER ADU..." is the property of its rightful owner. Permission is granted to download and print the materials on this web site for personal, non-commercial use only, and to display it on your personal computer provided you do not modify the materials and that you retain all copyright notices contained in the materials. By downloading content from our website, you accept the terms of this agreement.


Presentation Transcript

Slide1

MEETING THE NEEDS OF TODAY’S OLDER ADULTS

2020

AAA National Survey Report

Slide2

Conducted every three years since 2008 with funding through US Administration on Aging

Snapshot of the evolving AAA role in the planning, development, coordination and delivery of aging and other home and community-based services All data in this presentation, unless otherwise noted, is from the 2019 National AAA Survey. For details, visit

n4a.org.

About the National Survey of AAAs

Slide3

1

U.S. Census Bureau, The Baby Boom Cohort in the United States: 2012 to 2060, https://www.census.gov

/prod/2014pubs/p25-1141.pdf

By 2030,

1 in 5

(73 million)

Americans will be

65 or older

1

Over the next decade, the number of older adults will dramatically increase as the youngest baby boomers reach age 65.

An Aging Nation

Slide4

2

AARP, 2018 Home and Community Preferences: A National Survey of Adults Ages 18-Plus, August 2018,

https://www.aarp.org/research/topics/community/info-2018/2018-home-community-preference.html

To do so, many people will eventually need some level of service or support to live safely and successfully in their home or community.

86%

of adults age 65 and older say they hope to stay in their homes for as long as possible.

2

Slide5

3

Alzheimer’s Association, 2019 Alzheimer’s Disease Facts and Figure

https://www.alz.org/media/Documents/alzheimers-facts-and-figures2019-r.pdf

.

4

Office of the Assistant Secretary for Planning and Evaluation, U.S. Department of Health and

4

Human Services, Living Arrangements of People with Alzheimer’s Disease and Related Dementias: Implications for Services and Supports: Issue Brief,

https://aspe.hhs.gov/system/files/pdf/257966/LivingArran.pdf.

Additionally,

5.8

million

Americans are living with Alzheimer’s disease, the most common form of dementia.

3

80%

of people with dementia live in their homes

or with family, and 25 percent

live alone.

4

Slide6

5

Carla M.

Perissinotto

, , Irena

Stijacic

Cenzer,Kenneth E.

Covinsky, “Loneliness in Older Persons: A Predictor of Functional Decline and Death,” Archives of Internal Medicine,

172:14,2012, 1078–1083, doi:10.1001/archinternmed.2012.1993, https://www.ncbi.nlm.nih.gov/pubmed/22710744.

6

Erica Solway, John

Piette, Jeffrey

Kullgren et al., “Loneliness and Health. University of Michigan National Poll on Healthy Aging.”

March 2019. Available at:

http://hdl.handle.net/2027.42/148147

.

43%

of older adults have reported feeling lonely

5

and

27%

report feeling isolated

from others.

6

Slide7

7

Brian W. Ward, Jeannine S. Schiller, Richard A. Goodman. Multiple Chronic Conditions Among US Adults: A 2012 Update, Preventing Chronic Disease 2014;11:130389, https://www.cdc.gov/pcd/issues/2014/13_0389.htm#table1_down

8

Carlyn

M. Hood, Keith P. Gennuso, Geoffrey Swain, et al., “County Health Rankings Relationships Between Determinant Factors and Health Outcomes, ”American Journal of Preventive Medicine, 50:2, 2016, 129-35.

https://pubmed.ncbi.nlm.nih.gov

/26526164/

Research shows that social determinants of health

(e.g., access to nutrition, housing supports, or transportation) can prevent, delay or mitigate unnecessary and costly health care episodes

.

8

of older adults have at least

two+

chronic diseases

7

61%

86%

of older adults have at least

one

chronic disease

Social Determinants of Health

Slide8

In 2020 there are more than 600 AAAs serving older adults

in virtually every community in the nation. AAAs were formally established by the 1973 Older Americans Act (OAA) to respond to the needs of Americans 60 and over at the community level.AAAs adapt to the unique demands of their communities

by providing innovative programs that support the health and independence of older adults.

Nationwide Network with a Local Impact

Slide9

Planning

Developing

Coordinating

Delivering

A WIDE RANGE OF LONG-TERM SERVICES AND SUPPORTS

To consumers in their local planning and service area (PSA)

All AAAs play a key role in:

Slide10

50

Volunteers

(n=473)

21

Full-time staff

(n=472)

5Part-time staff(n=411)

AAA Workforce (Medians)

Slide11

n=487

Geographic Area Served by AAAs

Slide12

n=487

AAA Structure

Slide13

Includes abuse prevention and long-term care ombudsman programs

Information and referral

In-home services

Homemaker & chore services

Transportation

Case management

Home modificationLegal services

OAA CORE SERVICESFive Core Older Americans Act Services

All AAAs Offer

Slide14

Service

Percent (n=489)

Transportation services

89%

Case management

86%

Other meals/nutrition program

(e.g. nutrition counseling, senior farmer’s market program)

84%

Benefits/health insurance counseling

83%

Homemaker

81%

Benefits/health insurance enrollment assistance

80%

Personal assistance/personal care

79%

Other health promotion services/programs

(e.g., health screening, health fairs)

79%

Options counseling

79%

Assessment for care planning

73%

Other Services Offered by AAAs

Slide15

Service

Percent (n=489)

Elder abuse prevention/intervention services

69%

Senior center programming and activities

67%

Ombudsman services

66%

Chore services

66%

Assessment for long-term care service eligibility

64%

Home repair or modification

61%

Adult day service

57%

Emergency Response Systems

57%

Telephone reassurance/friendly visiting

55%

Translator/interpreter assistance

53%

Other Services Offered by AAAs

Slide16

n=

489

61%

provide home modifications and repair services

25%

offer a housing assistance program

8%own or operate housing for older adults

AAAs Support Older Adults Through Affordable and Accessible Housing

Slide17

n=489

Home Modification and Repair Services

Slide18

n=487, 437

Slide19

AAAs Designated as ADRC, SHIP and Ombudsman Programs

Slide20

n=

480, 482

AAAs Serve a Broad Range of Consumers

Slide21

Partner Type

Percent of AAAs with this Partner (n=482)

Adult protective services

92%

Transportation agencies

88%

State Health Insurance Assistance Program (SHIP)

86%

Emergency preparedness agencies

83%

Federal programs/ departments (e.g., Social Security, Veterans Administration Medical Center, Bureau of Indian Affairs)

81%

Mental health/behavioral health organization

80%

Medicaid

80%

Public housing authority or other housing programs

79%

Disability service organizations (e.g., Centers for Independent Living)

78%

AAA Partnerships

Slide22

Long-term care facilities (e.g., nursing homes, skilled nursing facilities, assisted living residences)

78%

Advocacy Organizations

77%

Hospitals and health care systems

74%

Law enforcement/first responders

72%

Charitable organizations (e.g., United Way, Easter Seals, Red Cross)

72%

Department of Health

72%

Other social service organizations

70%

Faith-based organizations

68%

Educational institutions

66%

Health

plans

(e.g., commercial health plan, Medicaid managed care)

62%

Community health clinics (e.g.,

Federally

Qualified Health Clinics)

60%

Partnerships

Slide23

Funding Source

Percent Reporting Any Funding from This Source

(n=430)

Average Budget Proportion*

* calculated based upon those AAAs that report any funding from this source

Older Americans Act

100%

44%

State general revenue

73%

24%

Local government

57%

17%

Medicaid/Medicaid waiver

43%

28%

Grant funds/philanthropy

39%

6%

Other federal funding

35%

9%

Other Notable Sources of Funding

Transportation funding (federal, state, or local)

20%

9%

Health care payer (hospital, managed care organization, Medicaid MCO, etc.)

18%

7%

Private pay revenue

16%

4%

Median Budget $3,985,710

Budget Range $230,912 - $377,170,448

AAA Funding Overview

Slide24

The U.S. Administration on Aging estimates

that for every

$1

of federal OAA investment,

an additional

$3 is leveraged.

AAAs Leverage Funding

Slide25

n4a

Meredith HanleyDirector, Community Capacity Building

202-872-0888

mhanley@n4a.org

AAA

[Insert agency contact information]

Contact Information