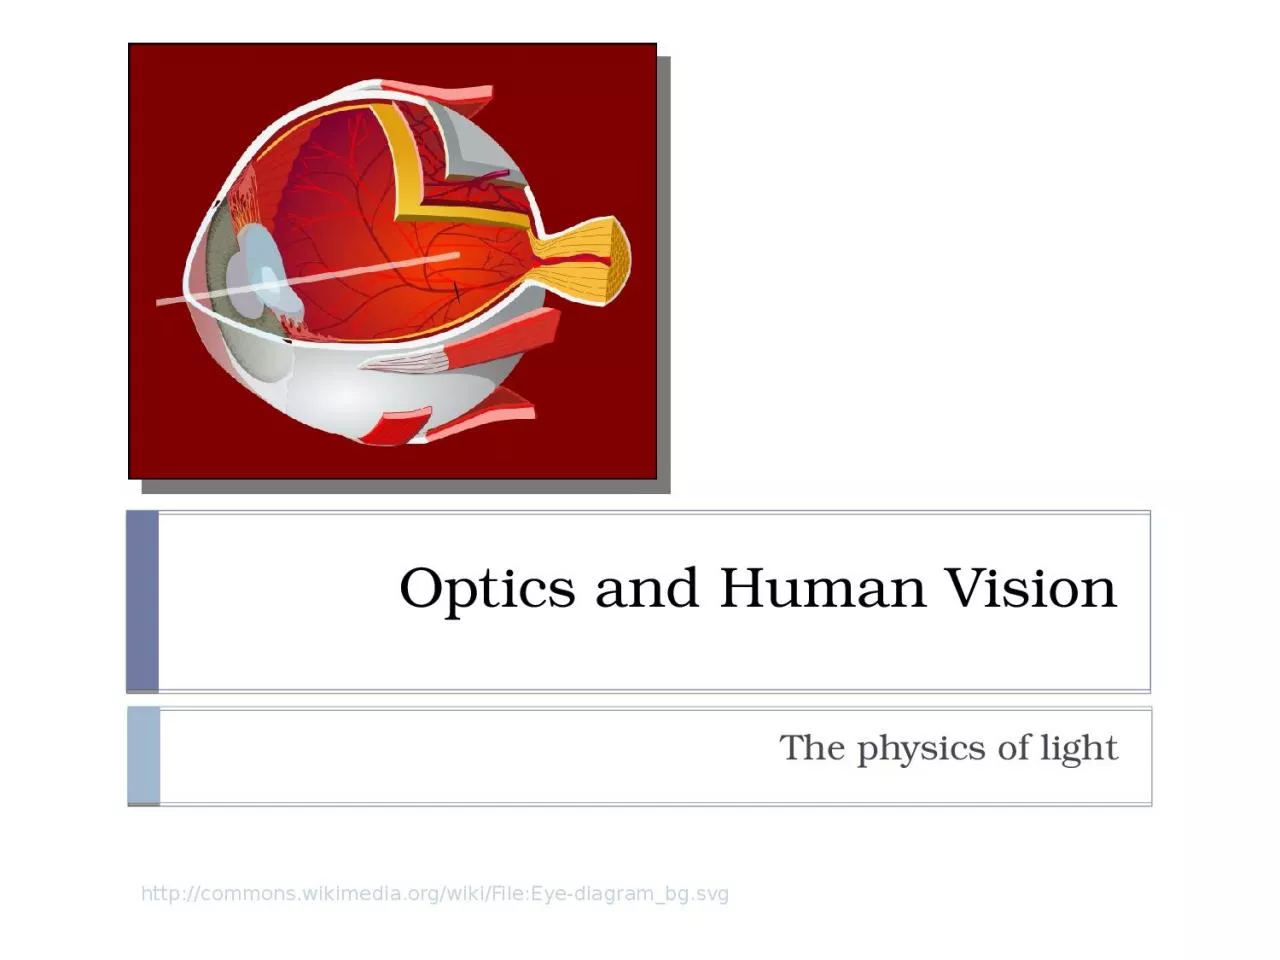
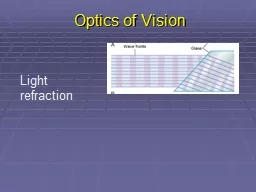
httpcommonswikimediaorgwikiFileEyediagrambgsvg Light Light Particles known as photons Act as waves Two fundamental properties Amplitude Wavelength Frequency is the inverse of wavelength ID: 930087
Download Presentation The PPT/PDF document "Optics and Human Vision The physics of l..." is the property of its rightful owner. Permission is granted to download and print the materials on this web site for personal, non-commercial use only, and to display it on your personal computer provided you do not modify the materials and that you retain all copyright notices contained in the materials. By downloading content from our website, you accept the terms of this agreement.
Slide1
Optics and Human Vision
The physics of light
http://commons.wikimedia.org/wiki/File:Eye-diagram_bg.svg
Slide2Light
LightParticles known as photons
Act as ‘waves’Two fundamental propertiesAmplitudeWavelength Frequency is the inverse of wavelength
Relationship between wavelength (lambda) and frequency (f)Where c = speed of light = 299,792,458 m / s
2
Slide3Light
Diagram of a light wave.
3
Slide4Light
4
Electromagnetic Spectrum
Slide5Thin Lens Equation
A lens is a transparent device that allows light to pass through while causing it to either converge or diverge.
Assume that a camera is focused on a target object using a single converging lens:Let S1 be the distance from the lens to the targetLet S2 be the distance from the lens to the filmThe focal length, f, is a measure of how strongly a lens converges light
The magnification factor, m, is another measure.The optical zoom of a digital camera is usually larger than 1The magnification factor of a single lens is usually less than 1
5
Slide6Thin lens equation
6
Slide7Optics and f-stop
7
F-number is the ratio of focal length to the diameter of the aperture (lens opening)
F-stops
are pre-defined aperture settings that are typically factors of 2 with respect to amount of light allowed into the camera.
Doubling
“area” of a circle implies scaling the aperture diameter by
sqrt
(2) or 1.4.
F-stops are geometric sequences involving powers of the square-root of 2.
Slide8Human Visual System
Human vision
Cornea acts as a protective lens that roughly focuses incoming lightIris controls the amount of light that enters the eye
The lens sharply focuses incoming light onto the retinaAbsorbs both infra-red and ultra-violet light which can damage the lens
The retina is covered by photoreceptors
(light sensors) which measure light
8
Slide9Anatomy of the Human Eye
9
Source: http://webvision.med.utah.edu/
Slide10Human Eye
10
Slide11Photoreceptors
Rods
Approximately 100-150 million rodsNon-uniform distribution across the retina
Sensitive to low-light levels (scotopic vision)
Lower resolutionConesApproximately 6-7 million cones
Sensitive to higher-light levels (
photopic
vision)
High resolution
Detect color by the use of 3 different kinds of cones each of which is sensitive to red, green, or blue frequencies
Red (L cone) : 564-580 nm wavelengths (65% of all cones)
Green (M cone) : 534-545 nm wavelengths (30% of all cones)
Blue (S cone) : 420-440 nm wavelengths (5% of all cones)
11
Slide12Cone (LMS) and Rod (R) responses
http://en.wikipedia.org/wiki/File:Cone-response.svg
12
Slide13Photoreceptor density across retina
13
Slide14Comparison between rods and cones
14
Rods
Cones
Used for night vision
Used for day vision
Loss causes night blindness
Loss causes legal blindness
Low spatial resolution with higher noise
High spatial resolution with lower noise
Not present in fovea
Concentrated in fovea
Slower time response to light
Quicker time response to light
One type of photosensitive
pigment
Three types of photosensitive pigment
Emphasis
on
motion detection
Emphasis
on detecting fine detail
Slide15Color and Human Perception
Chromatic light
has a color componentAchromatic light
has no color componenthas only one property – intensity
15
Slide16Human Visual Perception
Light intensity
:The lowest (darkest) perceptible intensity is the scotopic
threshold The highest (brightest) perceptible intensity is the
glare limitThe difference between these two levels is on the order of 1010We can’t
discriminate all these intensities at the same time
! We adjust to an average value
of
light intensities
and
then discriminate around the average.
Log compression.
Experimental results show that the relationship between the perceived amount of light and the actual amount of light in a scene are generally related logarithmically.
The human visual system perceives brightness as the logarithm of the actual light intensity and interprets the image accordingly.
Consider, for example, a bright light source that is approximately 6times brighter than another. The eye will perceive the brighter light as approximately twice the brightness of the darker.
16
Slide17Brightness Adaptation
Actual light intensity is (basically) log-compressed for perception.
Human vision can see light between the glare limit and
scotopic
threshold but not all levels at the same time.The eye adjusts to an average value (the red dot) and can simultaneously see all light in a smaller range surrounding the adaptation level.Light appears black at the bottom of the instantaneous range and white at the top of that range.
17
Slide18Brightness
Adaptation and Mach Banding
18
When viewing any scene:The eye rapidly scans across the field of view while coming to momentary rest at each point of particular interest.
At each of these points the eye adapts to the average brightness of the local region surrounding the point of interest. This phenomena is known as local brightness adaptation. Mach banding is a visual effect that results, in part, from local brightness adaptation.The eye over-shoots/under-shoots at edges where the brightness changes rapidly. This causes ‘false perception’ of the intensities
Examples follow….
Slide19Brightness
Adaptation and Mach Banding
19
Slide20Brightness Adaptation
20
Slide2121
Slide22Simultaneous Contrast
Simultaneous contrast refers to the way in which two adjacent intensities (or colors) affect each other.
Example: Note that a blank sheet of paper may appear white when placed on a desktop but may appear black when used to shield the eyes against the sun.Figure 2.9 is a common way of illustrating that the perceived intensity of a region is dependent upon the contrast of the region with its local background. The four inner squares are of identical intensity but are contextualized by the four surrounding squares
The perceived intensity of the inner squares varies from bright on the left to dark on the right.
22
Slide23Simultaneous Contrast
23
Slide24Chromatic Adaptation
24
What
is the color of this flower?
The color above is actually
green
!
In the image to the right, the “yellow” region from the trick image was cut and pasted onto the original.