/
A Critical Perspective on Measurement: MIMIC Models to Identify and Remediate Racial (and A Critical Perspective on Measurement: MIMIC Models to Identify and Remediate Racial (and

A Critical Perspective on Measurement: MIMIC Models to Identify and Remediate Racial (and - PowerPoint Presentation

Wildboyz
Wildboyz . @Wildboyz
Follow
348 views
Uploaded On 2022-08-03

A Critical Perspective on Measurement: MIMIC Models to Identify and Remediate Racial (and - PPT Presentation

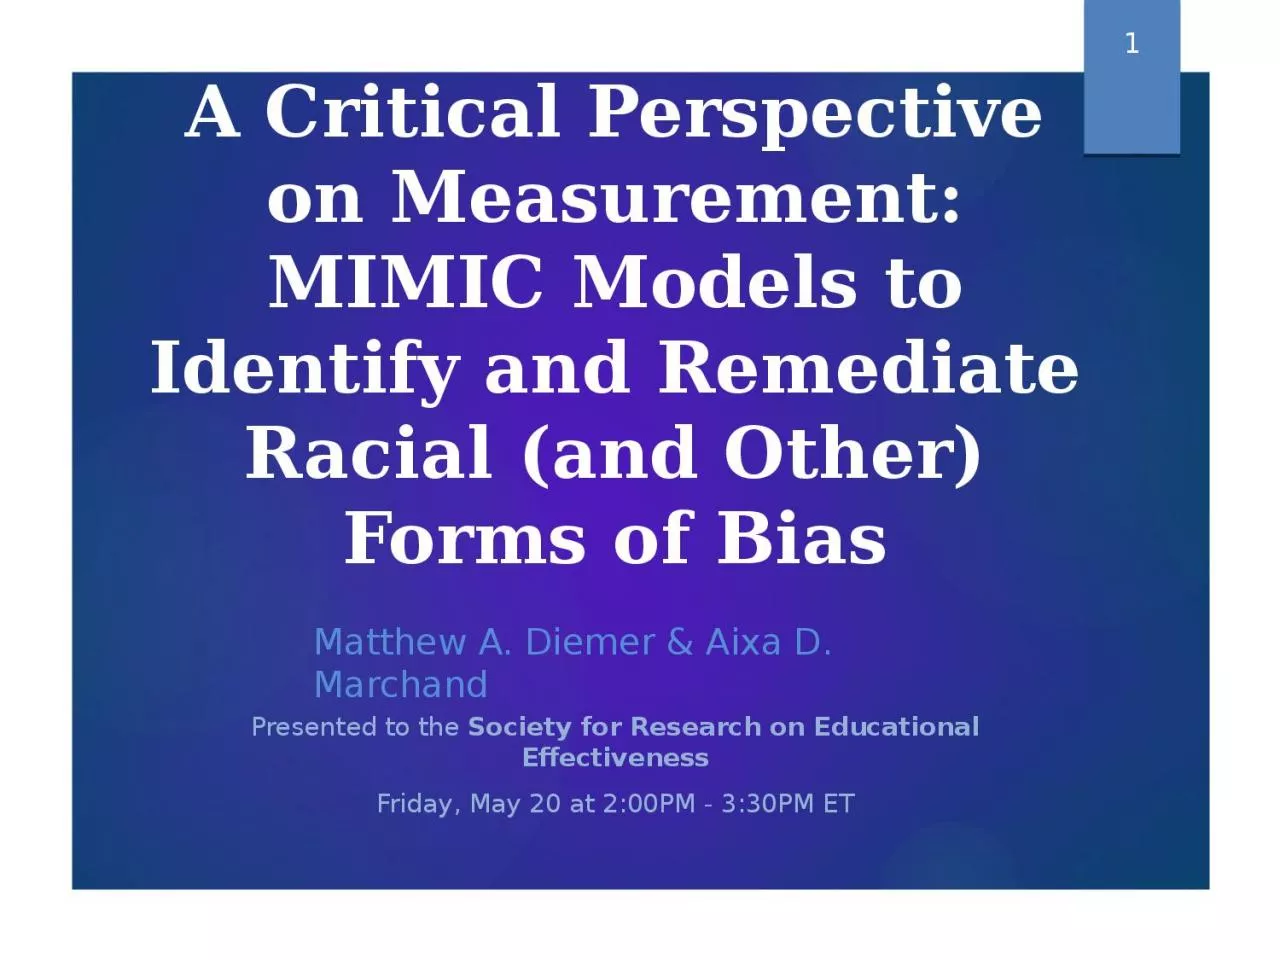
Presented to the Society for Research on Educational Effectiveness Friday May 20 at 200PM 330PM ET 1 Matthew A Diemer amp Aixa D Marchand Problematic History of Quantitative Methods Zuberi and BonillaSilva 2008 in ID: 933394

quantitative amp mimic race amp quantitative race mimic methods measurement models research social racial construct differences critical group 2021

Share:

Link:

Embed:

Download Presentation from below link

Download Presentation The PPT/PDF document "A Critical Perspective on Measurement: M..." is the property of its rightful owner. Permission is granted to download and print the materials on this web site for personal, non-commercial use only, and to display it on your personal computer provided you do not modify the materials and that you retain all copyright notices contained in the materials. By downloading content from our website, you accept the terms of this agreement.


Presentation Transcript

Slide1

A Critical Perspective on Measurement: MIMIC Models to Identify and Remediate Racial (and Other) Forms of Bias

Presented to the Society for Research on Educational EffectivenessFriday, May 20 at 2:00PM - 3:30PM ET

1

Matthew A. Diemer & Aixa D. Marchand

Slide2

Problematic History of Quantitative Methods

Zuberi and Bonilla-Silva (2008) in White Logic, White Methods: Racism & Methodology, document this problematic history. A brief overview:"Francis Galton was a key intellectual power behind the modern statistical revolution in the social sciences....Galton used statistical analysis to make general statements regarding the superiority of different classes within England and of the European-origin race, statements that were consistent with his eugenic agenda.“ (p. 128)

(See also Briggs, 2021)

2

Slide3

3

Problematic History of Quantitative Methods

Sir Francis Galton (1822-1911):Was a statistician and founder of psychometrics who developed the correlation coefficientFounded the ideology and scientific practice of eugenics

Galton’s work was then carried on by the eugenicist, Karl Pearson (1857-1936), who further developed the comparative method of the Pearson correlation coefficient in order to prove the intellectual superiority of the Aryan race. This has been well documented (Dixon-Román, 2019, p. 95)

Mid-1990s saw the

Bell Curve

& modern-day attempts to establish (White) racial superiority, using quantitative methods (much of this measurement-focused)

So, should we ‘throw the baby out with the bathwater’ and abandon quantitative methods (including psychometrics) if we want to center race, conduct anti-racist research, and/or maintain a critical perspective?

Slide4

Equity-Oriented or Anti-Racist Measurement

“It remains difficult to utilize the statistical tools created by eugenicists to study race & ethnicity in ways that do not lead to perpetuating that inequality.” (Viano & Baker, 2020, p. 304) And: “Positivistic statistical analyses have been central to the oppression of minoritized communities historically (Zuberi, 2001)

But: "Using racialized census, survey or other social data is not in and of itself problematic....statistical research can go beyond racial reasoning [including but not limited to justifying racial stratification] if we dare to apply the methods to the data appropriately.“ (Zuberi & Bonilla Silva, 2008)What we reject, however, is the idea that these analytical procedures can simply be reduced to the “master’s tools” (

Cokley

&

Awad

, 2013)

4

Slide5

Equity-Oriented or Anti-Racist Measurement

“The oft-cited quote “The Master’s Tools Will Never Dismantle the Master’s House” by Audre Lorde (1984) has been misinterpreted and used as a rationale for not utilizing quantitative methodology because of the belief that these methods are inherently oppressive (Unger, 1996)

Instead, Lorde was chastising White feminists for failing to recognize the differences among women based on social class, sexual identity, race and age, not advocating that women (or other oppressed groups) should not use quantitative methods.” (

Cokely

&

Awad

,

2013, p. 28)

“Q

uantitative methods are well placed to chart the wider structures, within which individuals live their everyday experiences, and to highlight the structural barriers and inequalities that differently racialized groups must navigate.” (

Gilborn

et al.,

2018, p. 160)

[These approaches] “will

not dismantle systemic racism, however, it is a

tool to begin to reimagine the role that research and data can play in an anti-racist society.” (Castillo & Gilborn, 2022, p. 3)

5

Slide6

Equity-Oriented or Anti-Racist Measurement

Instead, we will demonstrate how they can be used for critical, progressive social purposes. (Cabrera & Chang, 2019, p. 74)Notable example: “It is important to note that the statistical analyses played a central role in the overturning of A.R.S. 15 112, in part, because Dr. Cabrera temporarily took leave of his traditional roles as an educational advocate and instead played the role of objective social scientist. This was extremely difficult, but it was important to allow that statistics to be utilized by attorneys to utilize them for legal goals” (p. 91, ibid)

Why rigor matters: If you don’t argue scientifically, those who you disagree with will, and your views will not be heard (Wilson, 1990; see also Randall, 2021)Equity, justice, race, gender, and other issues can be ‘heard’ in different way by using sophisticated methods to examine them

6

Slide7

A Brief Annunciation: Crit Quant

A more general critical approach to quantitative methods, in solidarity with but not as paradigmatic or aligned with CRT as

QuantCRiT (Stage, 2007)

CritQuant

=

“to what extent educational research can offer critiques of our world that allow us to transform it”

(Baez,

2007, p. 18;

echoes of Freire

)

Q

uantitative

criticalist

[s]…use quantitative methods to represent educational processes and outcomes to reveal inequities and to identify perpetuation of those that were systematic. The term also included researchers who question models, measures, and analytical practices, in order to ensure equity when describing educational experiences.” (Stage & Wells, 2015, p. 1) – see also (p. 1273, Jang, 2018).In other words, what questions are asked & how they are posed as more important than specific methodsFor more work in this

area see

Randall, 2021, p. 88,

Table 1

for anti-racist extensions in measurement

7

Slide8

CritQuant: Core Elements

1. Knowing methods in order to critique, deconstruct, and reformulate them:

“[Alexander McQueen] learned the precision and skill in tailoring suits that later helped him deconstruct them without losing structure or integrity of the garment. This approach of mastering the rules well enough to know how to break them stayed with me.” (

Hernandez, 2018,

p. 93)

2. Deep understanding of critical theory

AND

methods (Randall, 2021; Stage, 2007)

3. Numbers & quantitative methods don’t have more inherent truth or rigor:

“This does not mean that critical race theorists should dispense with quantitative approaches but that they should adopt a position of principled ambivalence, neither rejecting numbers out of hand nor falling into the trap of imagining that numeric data have any kind of enhanced status, value, or neutrality.” (

Gilborn

et al.,

2018, p. 174)

4. Subjective & positional perspective:

Scholarship & methods are political; no such thing as value-free or objective inquiry (or culture- or context-free measurement, Randall, 2021)

5. Researcher self-reflexivity across the research enterprise (Suzuki et al., 2021)

8

Slide9

CritQuant: Possibilities

Let’s continue to use quantitative methods & not “throw the baby out with the bathwater”…“Quantitative methods are well placed to chart the wider structures, within which individuals live their everyday experiences, and to highlight the structural barriers and inequalities that differently racialized groups must navigate.” (

Gilborn

et al.,

2018, p. 160)

Lincoln and Guba (1985, well-known qualitative scholars) concluded that: “there are many opportunities for the naturalistic investigator to utilize quantitative data—probably more than appreciated” (as cited in Hernández,

2015, p. 199)

“Quantitative methods can be, have been, and should be used by scientists (along with other methods) to achieve the goals of social justice.” (

Cokley

&

Awad

,

2013, p. 27)

9

Slide10

A Grounding Example of CritQuant: Construct Bias: Apples, Oranges, & Piggly Wiggly

Imagine a scale at PriceChopper, Star Market, & Piggly Wiggly, or your favorite grocery store.You (omnisciently) put 10 lbs

of apples on that scale, it reads 10 lbs.You (omnisciently) put 10 lbs of oranges on that scale, it reads 7 lbs

(?)

This scale exhibits

construct bias

in how it measures oranges. From the perspective of the scholar Janet Helms, oranges are not measured with fairness (putting aside what experiences & perspectives of being an orange lead to this).

So:

For example, i

f the weight of oranges is used to predict some other thing

amount of juice extracted from the fruit

then we will not have fairness in how weight measurements are used

Which would an example of

predictive bias (or, problem with predictive validity)“biased tests yield score variance that reflects construct-irrelevant group differences, while good tests yield score variance that reflects construct-relevant group differences (e.g., high understanding of math concepts or high levels of experienced anxiety).” [quoting previous student’s HW]10

Slide11

Helms Individual-Differences (HID) Fairness Model

Race/ethnicity cannot be manipulated and is not a “variable” Janet Helms–argues race is only a social construct, not a biological reality, but yet also has profound social implicationsModel Summary: Psychological factors associated with race/ethnicity cause differences in test scores

What are these psychological factors? Examples include: Stereotype threat, impact(s) that feeling like a test is biased against you/your group, immersion (pro-Black and anti-White attitudes), racial identity status

Social/structural factors, such as White supremacy in item wording & content, vital but not within the purview of individual test-takers (Randall, 2021)

this is racism in the test construction process

Note: Some characterize this as construct bias & Helms characterizes this as ‘fairness’

similar, but not the same

11

Slide12

Helms Individual-Differences (HID) Fairness model (II)

Using race/ethnicity group membership (e.g., White vs African American) is only a rough proxy for these racial/ethnic psychological factorsIf we include race-based psychological factors in our models, then we do more to achieve fairness in testing (& we pay more attention to consequential validity)Ex: Enter Immersion status (pro-Black and anti-White attitudes),

in 1st step of regression, then racial group in 2nd Or: - .23 correlation btw Black Racial Identity & Cognitive, Ability, or Knowledge Scales (CAKS; p. 853, Table 1)

‘Construct irrelevant-variance’ in CAKS scores

---THIS CORRELATION SHOULD BE ZERO---

Because we have evidence of construct-irrelevant variance in a measure (CAKS, mechanical aptitude for females was aptitude + stereotype threat), then we have construct bias

or, (un)fairness

12

Slide13

A ‘Validity Strategy’ to Address Fairness

MIMIC models: “I suggest as one of the ‘pragmatic strategies for identifying or removing unfairness from individual test takers’ scores if construct-irrelevant variance is discovered” (Helms, 2006, p. 846)  if that construct-irrelevant variance is group-based measurement error

 this is a way of assessing construct biasi.e., “Random error variance or factors that are wholly unrelated to individual differences in the trait measured by the test” (Frisby, 1999, p. 264)

MIMIC models would identify items that exhibit bias, in that they function differently across groups

or

one dimension of test fairness

13

Slide14

A ‘Validity Strategy’ to Address Fairness

On the other hand, MIMIC models reify racial/ethnic categorization, and would only address issues of fairness inasmuch as categorizing race captures, or measures, dimensions of racial/ethnic socialization, cultural practice, etc., that contribute to group differences on tests (from Helms’ perspective)Further, race as a category fails to capture structural racism, inequitable policing, anti-Blackness, etc.MIMIC models would only measure racial/ethnic differences by proxy, via categorizing race/ethnicity

MIMICs do not capture the “racial or cultural psychological attribute” (e.g., stereotype threat, immersion [pro-Black and anti-White attitudes]) that contribute construct-irrelevant variance to scoresThis is therefore more of a ‘validity strategy’ than a ‘fairness strategy’ to use the terminology from the Helms (2006)

14

Slide15

Sample MIMIC15

We are used to seeing circles predict boxes (on the R side of this diagram), here we instead have boxes predicting circles on L side of diagram [

not “LHS/RHS” equation]

Paths from exogenous covariates to indicators only suggested here…

Model addresses this prompting: “Will specific identity groups be particularly disadvantaged by the ways in which the construct is being defined?” (Randall,

2021, p. 88)

Motivation: Critiques of CC scholarship

Slide16

MIMIC Models: Conceptual Basis

In education & in psychology, we often want to answer questions like the following:How do background characteristics (also called exogenous covariates, which are traditionally 0 or 1 in the MIMIC method) relate to differences on latent factors or observed indicators? Also stated: How does an exogenous covariate predict individual differences on a latent construct?

How does an exogenous covariate predict responses to an individual item?For ex: How does gender predict scores on an expressive language measure? How does gender predict responses to the individual items that comprise the expressive language measure (i.e., are the items biased?)For ex: How do “low achievers” and “high achievers” differ when measuring X and Y?

16

Slide17

MIMIC Models: Conceptual Basis

MIMIC [Multiple Indicators and Multiple Causes] models are CFAs with exogenous covariate(s) and are well-suited to answer these questionsMIMIC models also afford probing:

Latent mean differences (which, because measurement error is parceled out, are more precise comparisons than t-tests of observed means) Differential item functioning (does group membership predict differential responding to an item)Differential Item Functioning, or DIF, is an important aspect of Item Response Theory (IRT)

Parameterization of DIF

etc

similar in IRT vs MIMIC approaches

17

Slide18

Technical Specifications of MIMICs

MIMIC models are a way of testing moderationA moderator variable “alters the direction or strength of the relation between a predictor and an outcome” (Frazier, Tix & Barron, 2004).Here, the moderating variable is group membership of some kind  does group membership predict latent mean differences or differential item functioning (DIF)?

SEM = very powerful & flexible analytic framework. MIMIC models = an SEM analysis that capitalizes on flexibility MIMIC models (traditionally) use dichotomous exogenous covariates

dummy code or dichotomize non-dichotomous variables

MIMIC models are carried out with the entire sample, in contrast to multi-group CFA , which fits the same CFA model to each group, separately

Although MIMIC models are a variant of CFA models, there are no special considerations with regard to identification & estimation for MIMIC models

18

Slide19

What do MIMICs Establish?

Strong Invariance (a.k.a. Scalar invariance)  presuppose configural (same ‘configuration’ of boxes to circles’) & metric (same ‘metric’ of loadings across groups’) invarianceUnstandardized intercepts between groups are constrained to be equalTwo people from different groups with the same level on a certain factor (or, latent variable) have the same score on a given indicator

Scalar Invariance: Practical example: men and women with equal levels of depression self-report the same amount of binge eating

Vs

Scalar

Variance (or, non-invariance)

:

At the same level of depression, women binge-eat twice per week and men binge-eat 4 times per week, even though the slopes (increases as depression increases) may be the same

19

Slide20

Empirical Example

20

Aim:

test if youth who vary in political ideology (i.e., conservative, liberal) and political identification (i.e., Republican, Democrat) participate at different levels and whether this measurement of sociopolitical participation is biased 

Slide21

Empirical Example

21

Slide22

Empirical Example

22

Slide23

Empirical Example

23

.

43

*

Slide24

Empirical Example: Conclusions

Identified no DIF in any itemsIf so, we would have seen DIF modeled as a direct line from one of the exogenous covariate to an individual itemSuggests that within our sample this measure of sociopolitical participation is not biased by political ideology, party identification, or the other covariates tested such as race/ethnicity, gender, and SES 

Found slight effect in identification and marginal effect in race/ethnicity Small association with sociopolitical participation suggesting a trend that Republican identifying youth participate slightly more frequently than those who identify as Democrat

If sociopolitical participation was indeed biased by left-leaning ideology, then we would expect the its measurement to exhibit DIF in ideology and identification 

Suggests that diverse populations of youth across different political perspectives are engaged in the political system through their sociopolitical participation at similar levels and that the items aren’t biased towards on ideology or political party

24

Slide25

Summary:Affordances of MIMICs

Simple, yet effective, strategy to detect, remediate, or eliminate biased items Also affords testing for item bias while statistically adjusting for latent mean differencesEfficient in detecting bias in latent means (levels) and DIF (items biased across groups)

More precise than ANOVAs because measurement error parceled outDIF in MIMICs concordant with DIF in IRT methodsNote: MIMIC models do not establish Measurement Invariance (MI), which is a more intensive & stepwise process

Can adjust for item bias when estimated full SEMs

MIMICS sound intimidating…but are not that complicated to estimate and interpret

Also

: Easier & require lower N than full measurement invariance (MI) testing

“unlike multigroup factor analysis…, several covariates can be incorporated into the MIMIC model without subdividing the sample” (Gallo et al., 1994, p. 252)

25

Slide26

MIMICs: Limitations

Cannot formally declare measurement invariance (intercepts tested, but not the slopes, which are factor loadings}Group membership is modeled as a dichotomy, when it’s [much] more than that

While mindful that: “It follows that every attempt to ‘measure’ the social in relation to ‘race’ can only offer a crude approximation that risks fundamentally misunderstanding and misrepresenting the true nature of the social dynamics that are at play” (Gilborn

et al., 2018; Helms et al., 2005)

The multifaceted nature of race and ethnicity suggests that when race is operationalized as a stable, homogenous entity (e.g., a simple dummy or categorical variable like “1” if white, “0” if nonwhite), any statistical association will typically offer little or no insight as to which elements are the key mechanisms of action—be it fear of an out-group, neighborhood effects, or some other factor.” (

Sen &

Wasow

, 2016, p. 517)

MIMICs oversimplify racial/ethnic identification, intersectional identities, etc. into a 0 or 1

Some advances on intersectional measurement (Russe

ll,

Szendey

& Kaplan, 2021), yet measures that are fully intersectional are rare (

exception:

Buchanan, 2016, Racialized Sexual Harassment Scale)26

Slide27

MIMICs: Limitations

One point of synthesis btw Helms’ HID model & MIMICs: Measure racial identity status and (mean or median) split participants into two groups, such as “low” and “high” levels of Immersion (pro-Black and anti-White attitudes) or racial identity status (or, stereotype threat – perhaps measured physiologically)

OR: high & low scores on the MIBI  perhaps split on private regard or nationalist profile

But making a continuous scale dichotomous is anathema in the measurement field, so?

Our methodology is lagging behind our conversations and theorizing about equity & justice

27

Slide28

Summary: CritQuant

Critical theory and intersectionality theory outpace our quantitative enactment of those theoriesStated another way, our theorizing outpaces our methodological specification of theoryMore innovation in the quantitative space is needed….is it agent-based modeling? A move away from the linear model? Bayesian approaches? None of which are a ‘silver bullet’ 

what to keep?Humbly, the CritQuant approach taken here was to combat longstanding & legitimate critiques of a construct grounded in critical theory (i.e., critical consciousness) This MIMIC/quantitative approach provided a unique form of evidence to counter claims that critical consciousness/the CCS are biased against conservatives or Republicans

As well as along social identity axes, such as race/ethnicity (as a binary, which is a limitation), gender (again, as a binary), and social class

Quantitative approaches to critical consciousness acknowledge the political and subjective nature of inquiry, maintain reflexivity, and consider quant evidence one form of evidence (not THE form of evidence) to support claims

Here, harnessing quantitative methods to advance critical consciousness theory =

CritQuant

28

Slide29

Resources for Further Study

Conceptual basis of MIMICs: Kano, Y. (2001). Structural equation modeling with experimental data. In R. Cudeck, S. du Toit, and D. Sörbom (Eds.), Structural equation modeling: Present and future

(pp. 381-402). Lincolnwood, IL: Scientific Software International.Kaplan, D. (2000). Structural equation modeling. Thousand Oaks, CA: Sage.Advanced extension of MIMIC models: Kaplan, D. (1999): An extension of the propensity score adjustment method for the analysis of group differences in MIMIC models,

Multivariate Behavioral Research, 34:4

, 467-492

Controlling for differences identified in a MIMIC: Aiken, L.S., Stein, J.A. & Bentler, P.M. (1994). Structural equation analyses of clinical subpopulation differences and comparative treatment outcomes: Characterizing the daily lives of drug addicts.

Journal of Consulting and Clinical Psychology, 62(3)

, 488-499.

Empirical example of MIMIC model in instrument validation:

Duffy, R.D., Diemer, M.A., Perry, J.C. &

Laurenzi

, C.,

Torrie

, C. (2012). The construction and initial validation of the Work Volition Scale.

Journal of Vocational Behavior, 80(2)

, 400-411.Empirical example of MIMIC: Diemer, M.A., Voight, A.M., Marchand, A.D. & Bañales, J. (2019). Political identification, political ideology, & perceptions of inequality among marginalized youth. Developmental Psychology special issue: “Children’s and Adolescents’ Understanding and Experiences of Economic Inequality: Implications for Theory, Research, Policy and Practice” 55(3), 538-549.Marchand, A. D., Frisby, M., Kraemer, M. R., Mathews, C. J., Diemer, M. A., & Voight, A. M. (2021). Sociopolitical Participation Among Marginalized Youth: Do Political Identification and Ideology Matter?. Journal of Youth Development, 16(5), 41-63.29

Slide30

Reference List

Baez, B. (2007). Thinking critically about the “critical”: Quantitative research as social critique. New Directions for Institutional Research, 2007(133), 17–23.

https://doi.org/10.1002/ir.201Briggs, D. C. (2021). Historical and Conceptual Foundations of Measurement in the Human Sciences: Credos and Controversies

. Routledge.

Buchanan, N. T. (2016, October 20). Racialized Sexual Harassment: Living at the intersections of race, gender and victimization [Webinar]. In M.

Paludi

(chair), Sexual harassment: 25 years of research, legislation, court cases and prevention strategies.

http://media.wp.excelsior.edu/shrm_ in-honor-of-the-25th-anniversary-of-anita-hilltestimony/

Cabrera, N. L., & Chang, R. S. (2019). Stats, Social Justice, and the Limits of Interest Convergence: The Story of Tucson

Unified’s

Mexican American Studies Litigation. 

Association of Mexican American Educators Journal

13

(3), 72-96.

Castillo, W., & Gillborn, D. How to “QuantCrit:” Practices and Questions for Education Data Researchers and Users. Cokley, K., & Awad, G. H. (2013). In defense of quantitative methods: Using the “master’s tools” to promote social justice. Journal for Social Action in Counseling & Psychology, 5(2), 26-41. Dixon‐Román, E. (2020). A haunting logic of psychometrics: Toward the speculative and indeterminacy of blackness in measurement. Educational Measurement: Issues and Practice, 39(3), 94-96.Frazier, P. A., Tix, A. P., & Barron, K. E. (2004). Testing moderator and mediator effects in counseling psychology research. Journal of counseling psychology, 51(1), 115. 30

Slide31

Reference List

Frisby, C. L. (1999). Culture and test session behavior: Part I. School Psychology Quarterly, 14(3), 263. Gallo, J. J., Anthony, J. C., & Muthén

, B. O. (1994). Age differences in the symptoms of depression: A latent trait analysis. Journal of Gerontology, 49(6), P251-P264.Gillborn, D., Warmington, P., &

Demack

, S. (2018).

QuantCrit

: Education, policy, ‘Big Data’ and principles for a critical race theory of statistics.

Race Ethnicity and Education

,

21

(2), 158–179.

https://doi.org/10.1080/13613324.2017.1377417

Helms, J. E. (2006). Fairness is not validity or cultural bias in racial-group assessment: A quantitative perspective. 

American Psychologist

61(8), 845. Helms, J. E., Jernigan, M., & Mascher, J. (2005). The meaning of race in psychology and how to change it: a methodological perspective. American Psychologist, 60(1), 27.Hernández, E. (2015). What Is “Good” Research? Revealing the Paradigmatic Tensions in Quantitative Criticalist Work. New Directions for Institutional Research, (163), 93–101. https://doi.org/10.1002/ir.20088Jang, S. T. (2018). The Implications of Intersectionality on Southeast Asian Female Students’ Educational Outcomes in the United States: A Critical Quantitative Intersectionality Analysis. American Educational Research Journal, 55(6), 1268–1306. https://doi.org/10.3102/0002831218777225Randall, J. (2021). Color-neutral” is not a thing: Redefining construct definition and representation through a justice-oriented critical antiracist lens. Educational Measurement: Issues and Practice, 40(4), 82-90.

31

Slide32

Reference List

Russell, M., Szendey, O., & Kaplan, L. (2021). An Intersectional Approach to DIF: Do Initial Findings Hold across Tests?. Educational Assessment, 26(4), 284-298.

Sen, M., & Wasow, O. (2016). Race as a bundle of sticks: Designs that estimate effects of seemingly immutable characteristics. Annual Review of Political Science, 19.

Stage, F. (Ed.) (2007).

Using Quantitative Data to Answer Critical Questions: New Directions for Institutional Research

. Jossey-Bass.

Stage, F. K., & Wells, R. S. (Eds.) (2015). New scholarship in critical quantitative research, part 1: Studying institutions and people in context.

New Directions for Institutional Research, 158

.

Suzuki, S., Morris, S. L., & Johnson, S. K. (2021). Using

QuantCrit

to advance an anti-racist developmental science: applications to mixture modeling. 

Journal of Adolescent Research

36

(5), 535-560. Unger, R.K. (1996). Using the master’s tools: Epistemology and empiricism. In S. Wilkinson (Ed.), Feminist social psychologies: International perspectives(pp.165-181). Buckingham, England: Open University Press. Viano, S., & Baker, D. J. (2020). How Administrative Data Collection and Analysis Can Better Reflect Racial and Ethnic Identities. Review of Research in Education, 44(1), 301–331. https://doi.org/10.3102/0091732X20903321Wilson, 1990Zuberi, T. (2001). Thicker than blood: How racial statistics lie. U of Minnesota Press.Zuberi, T., & Bonilla-Silva, E. (Eds.). (2008). White logic, white methods: Racism and methodology. Rowman & Littlefield Publishers.32

Slide33

Thank You

Matthew A. Diemerdiemerm@umich.edu @ProfDiemerAixa D. Marchand marchanda@rhodes.edu @

AixaMarchand

33