/
Seasonal Arctic sea ice in the NMME Seasonal Arctic sea ice in the NMME

Seasonal Arctic sea ice in the NMME - PowerPoint Presentation

aaron
aaron . @aaron
Follow
362 views
Uploaded On 2018-02-26

Seasonal Arctic sea ice in the NMME - PPT Presentation

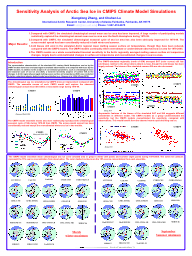
Kirstin Harnos Michelle LHeureux Qin Zhang and Qinghua Ding Images courtesy of National Snow Ice Data Center Current State of Sea Ice Images courtesy of National Snow Ice Data Center Current Events ID: 636262

nmme ice sie sea ice nmme sea sie observations trends total decade year skill trend steepening square root increase

Share:

Link:

Embed:

Download Presentation from below link

Download Presentation The PPT/PDF document "Seasonal Arctic sea ice in the NMME" is the property of its rightful owner. Permission is granted to download and print the materials on this web site for personal, non-commercial use only, and to display it on your personal computer provided you do not modify the materials and that you retain all copyright notices contained in the materials. By downloading content from our website, you accept the terms of this agreement.


Presentation Transcript

Slide1

Seasonal Arctic sea ice in the NMME

Kirstin Harnos, Michelle L’Heureux, Qin Zhang, and Qinghua DingSlide2
Slide3
Slide4

Images courtesy of National Snow Ice Data Center

Current State of Sea IceSlide5

Images courtesy of National Snow Ice Data Center

Current Events:

Northwest PassageSlide6

Previous Studies:Sea Ice Research & Prediction

General

Sea Ice extent is decreasing, with trends steepening

InitializationB

etter initial conditions (including thickness) = better skill at longer leads

Trend

Highest skill from ability to capture

trend

Multi-model

Multi-model ensembles better than individual modelsSlide7

NMME and Sea Ice

How well does NMME predict sea ice?Sea ice extent (SIE)

= Total area ≥ 15% concentration

Skill metrics:Model Bias

Anomaly Correlation

Root Mean Square Error

Trend and Variability

Total SIE

Year-to-year SIE

1982-2010

hindcast climatology

, 1 to 9 month lead

Observations

:

NASA Bootstrap gridded sea ice concentrations Slide8

NMME Sea Ice Contributions

only using 16 of the members following past CFSv2 sea ice publications

complete

hindcast

records on the NCAR NMME archiveSlide9

Climatology Slide10

Total SIE

Bias

[10

6

km

2

]

Less Ice

More IceSlide11

Year-to-Year SIE

Root Mean Square ErrorSlide12

Total SIE

Anomaly CorrelationSlide13

Year-to-Year SIE

Anomaly CorrelationSlide14

NMME reduces total SIE biasconsequence of large opposite biases in individual models?

Y2Y largest errors during fall/winter (SIE minimum)NMME slight improvement during shorter leads in fall/winterTrend dominates ACC values

consistent with past studieslittle to no Y2Y skill beyond 5 monthsSlide15

TrendSlide16

The Trend

P

roblem

Mark C. Serreze, and Julienne

Stroeve

Phil. Trans. R. Soc. A 2015;373:20140159

© 2015 The Author(s) Published by the Royal Society. All rights reserved.Slide17

Observations:

Observations: Slide18

Observations: -13.4 % per decade

Observations: - 2.6% per decadeSlide19

Observations: -13.4 % per decade

NMME: -5.7% to -3.9% per decade

Observations: - 2.6% per decade

NMME: -1.8% to -1.2% per decade

Blue: NMME Ensemble mean spreadSlide20

1982

1985

1988

1991

1994

1998

2001

2004

Observed SIE Anomaly

[10

6

km

2

]

NMME September

Root Mean Square Error

NMME

Root Mean Square ErrorSlide21

General: Sea Ice trends non linear and steepening

September NMME trends less than observed

Increase in September RMSE in most recent yearsmodel inability to capture steepening trends?Increase trends in observations = increase variance = increase RMSESlide22

Take Home

NMME reduces total SIE bias

High skill associated with trendSIE trends are steepening, models need to monitor and adjust to capture changing trends