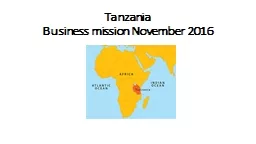
/
Tanzania  Business mission November 2016 Tanzania  Business mission November 2016

Tanzania Business mission November 2016 - PowerPoint Presentation

aaron
aaron . @aaron
Follow
369 views
Uploaded On 2018-03-18

Tanzania Business mission November 2016 - PPT Presentation

Belgium Tanzania 2015 EUROSTAT EU Trade TANZANIA Statistics Imports Exports Reporters Partners EU28 Tanzania United Republic of Products All products Years 2015 Indicators ID: 655540

2015 tanzania power opportunities tanzania 2015 opportunities power gas united republic 000 natural energy

Share:

Link:

Embed:

Download Presentation from below link

Download Presentation The PPT/PDF document "Tanzania Business mission November 2016" is the property of its rightful owner. Permission is granted to download and print the materials on this web site for personal, non-commercial use only, and to display it on your personal computer provided you do not modify the materials and that you retain all copyright notices contained in the materials. By downloading content from our website, you accept the terms of this agreement.


Presentation Transcript

Slide1

Tanzania Business mission November 2016Slide2

Belgium Tanzania 2015

EUROSTAT -EU Trade TANZANIA

Statistics

(Imports - Exports)

Reporter(s) / Partner(s): EU28 / Tanzania, United Republic of

Product(s): All products

Year(s): 2015

Indicators

Import Value to the EU/MS (EURO)

Export Value from the EU/MS (EURO

)

Total (EURO)

Partners

Tanzania, United Republic of

Tanzania, United Republic of

Tanzania, United Republic of

Years

2015

2015

2015

Reporters


Belgium

178,499,693

144,387,488

322,887,181

Germany

141,473,802

120,253,657

261,727,459

United Kingdom

39,187,368

165,404,717

204,592,085

France

36,283,099

160,637,694

196,920,793

Netherlands

64,767,649

122,997,338

187,764,987

Italy

39,283,072

91,383,881

130,666,953

Sweden

5,630,593

79,734,692

85,365,285

Ireland

53,021,609

17,214,718

70,236,327

Spain

23,850,890

29,544,687

53,395,577

Poland

27,547,394

22,357,689

49,905,083

Finland

4,875,565

27,078,024

31,953,589

Portugal

26,042,580

4,714,120

30,756,700Slide3

The economy of Tanzania is sustained by

The agriculture sector, ICT sector, The tourism sector,

Energy

The extraction industry

OthersSlide4

Agriculture

Accounts for: 25% of

the

GDP, Provides

95 percent of food

requirement, Employs

75 per cent of the population

Crops like corn, cassava, sweet potatoes, beans, bananas, millet, tobacco, coffee, tea, cashew nuts, sisal and cotton. Meat production: 55% comes from cattle, 21% from sheep and goats, 14% from pigs, and 10% from chicken Fisheries : 64 000 KM² of Marine water, 223.000 KM² of EEZ & 58.000 KM² of wetlands. Production =+/- 800.000 metric tonsOpportunities : Farming, Agro-processing, Tools machinery, Fertilisers, Education, Logistics, Packaging, to mention a fewSlide5

ICT

National ICT Backbone (NICTBB)Mobile phone subscribers up by 25

pct

in 2015

Operators : 12,7 million with Vodacom (S.A.), 11,1M with

Tigo

(Sweden) 11M with irtel (India), Zantel (UAE) 1,8M mainly in Zanzibar and 1,2M with

Halotel (Vietnam). 39M subscribers out of 50M people.Internet penetration: 17M users most wireless.Opportunities : Mobile money, applications for farming, E-learning, etcSlide6

TourismEmploys over

10

percent of the total work force of

Tanzania and generates 5% of the GDP

Around 1,15M tourists in 2015 expected to reach 1,63 in 2025

Opportunities:

Horeca, travel, insurance, infrastructureSlide7

Energy - LNG

In Q1 2016 an additional 2.7 trillion cubic feet (

tcf

) of natural gas deposits raised

Tanzanias

estimated recoverable natural gas reserves to 57

tcf

(1,6 trillion m³).All major international players are thereUSD 10 to 20 billion investment is projected for exploration and production in the coming decade.Sumitomo/Mitsubishi/Toshiba(Japanre

building a 245MW for 2018 a natural gas-fired power plant in Kinyerezi II (30kms south of Dar Es Salaam). Kinyerzi I has already 70MW on grid Symbion and Ubungo

II, which previously ran on expensive A1 jet fuel, were able to switch to cheaper, clean natural gas. The 180 MW of electricity generated by these plants is cleaner and more sustainable as a result.Opportunities in equipment, supply chain, logistics, drilling, piping, construction, port infrastructure, finance, transport, power and so many more.Slide8

Energy: ELECTRICITY

Tanzania has 1486MW on 4,869 km of transmission lines at 220 kV, 132 kV, and 66 kV. Tanesco is Tanzania’s main Electricity operator with 1.8 million customers and a target of 5 million connected customers by 2022.

550MW is Hydro, 650MW is Gas and 300MW Oil.

Tanzania is suffering from chronic power shortages due to a decline in hydroelectric power generation.

Opportunities: Any power related equipment, small power projects, green energy, electrification, distribution, consultancy, generatorsSlide9

Mining

In 2015 Tanzania’s exports amounted to 4,535 BillionTZS (1,9

Bil

€) with Gold representing 2,717 BTZS and Diamonds 65 BTZS.

Mining in Tanzania includes metals (gold, iron ore, nickel, copper, cobalt, silver), industrial minerals (diamond, tanzanite, ruby, garnet, limestone, soda ash, gypsum, salt, phosphate, gravel, sand, dimension stones and lately graphite), and fuel minerals (coal, uranium).

Mining and quarrying activities in Tanzania contributed 3.7% to its GDP with USD 1.78bn in 2014, compared to only USD 598m in 2009, representing a value increase of almost 200%.Slide10

Others

Basically all segments present opportunities: water, health, education, industrialisation, services, automotive, chemicals, pharmaceuticals, tools machinery, entertainment, banking, construction, real estate, airplanes and others.

Opportunities also mean

: Investment – Funds – Risks – Time – information – Commitments – Patience – Rules & Licencing - Flexibility and strategies