/
CONSERVATIVE CONSERVATIVE

CONSERVATIVE - PDF document

abigail
abigail . @abigail
Follow
350 views
Uploaded On 2021-06-14

CONSERVATIVE - PPT Presentation

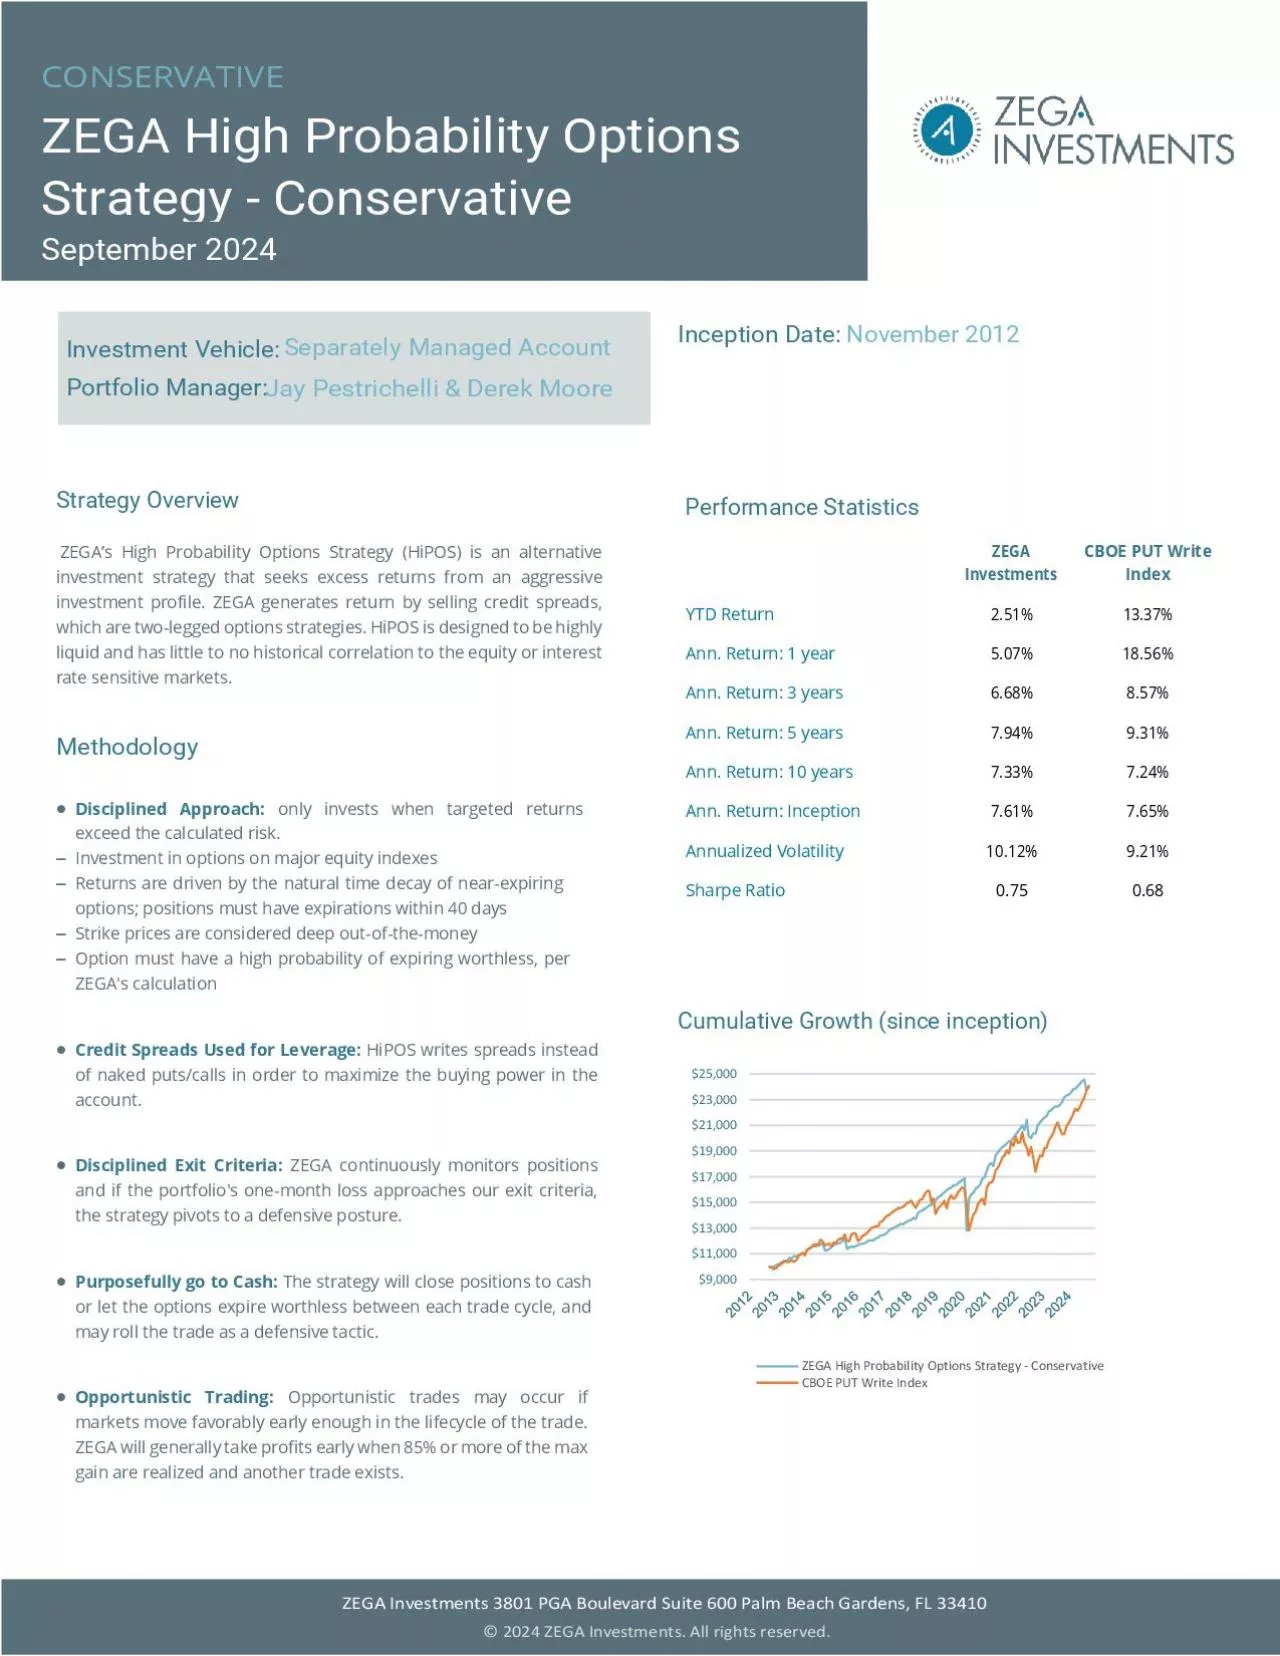
ZEGA High Probability Options Strategy Conservative April 2021 777 South Flagler Drive Suite 800 West Tower West Palm Beach FL United States 33401 800 380 9342 serviceZEGA ID: 842257

strategy zega investment options zega strategy options investment 000 performance return conservative returns index put probability high portfolio write

Share:

Link:

Embed:

Download Presentation from below link

Download Pdf The PPT/PDF document "CONSERVATIVE" is the property of its rightful owner. Permission is granted to download and print the materials on this web site for personal, non-commercial use only, and to display it on your personal computer provided you do not modify the materials and that you retain all copyright notices contained in the materials. By downloading content from our website, you accept the terms of this agreement.


Presentation Transcript

1 CONSERVATIVE ZEGA High Probability O
CONSERVATIVE ZEGA High Probability Options Strategy - Conservative April 2021 777 South Flagler Drive, Suite 800 West Tower • West Palm Beach, FL (United States) • 33401 • (800) 380 - 9342 • service@ZEGAFinancial.com © 20 20 ZEGA Financial. All rights reserved. Strategy Overview ZEGA’s High Probability Options Strategy (HiPOS) is an alternative investment strategy that seeks excess returns fr om an aggressive investment profi le. ZEGA generates return by selling credit spreads, which are two - legged options strategies. HiPOS is designed to be highly liquid and has little to no historical correlation to the equity or interest rate sensitive markets. Methodology • Disciplined Approach: only invests when targeted returns exceed the calculated risk. – Investment in options on major equity indexes – Returns are driven by the natural time decay of near - expiring options; positions must have expirations within 40 days – Strike prices are considered deep out - of - the - money – Option must have a high probability of expiring worthless, per ZEGA's calculation • Credit Spreads Used for Leverage: HiPOS writes spreads instead of naked puts/calls in order to maximize the buying power in the account. • Disciplined Exit Criteria: ZEGA continuously monitors positions and if the portfolio's one - month loss approaches our e xit criteria, the strategy pivots to a defensive posture. • Purposefully go to Cash: T he strategy will close positions to cash or let the options expire worthless between each trade cycle, and may roll the trade as a defensive tactic. • Opportunistic Trading : Opportunistic trades may occur if markets move favorably early enough in the lifecycle of the trad e. ZEGA will generally take profi ts early when 85% or more of the max gain are realized and another trade exists. Cumulative Growth (since inception) $9,000 $10,000 $11,000 $12,000 $13,000 $14,000 $15,000 $16,000 $17,000 $18,000 $19,000 $20,000 2012 2013 2014 2015 2016 2017 2018 2019 2020 2021 ZEGA High Probability Options Strategy - Conservative CBOE PUT Write Index ZEGA Financial CBOE PUT Write Index YTD Return 5.29% 7.05% Ann. Return: 1 year 20.87% 30.97% Ann. Return: 3 years 9.97% 5.85% Ann. Return: 5 years 9.72% 7.24% Ann. Return: Inception 7.71% 6.93% Annualized Volatility 11.61% 9.45% Sharpe Ratio 0.72 0.66 Jay Pestrichelli & Mick Brokaw Investment Vehicle: Separately Managed Account Portfolio Manager: Inception Date: November 2012 Performance Statistics CONSERVATIVE ZEGA High Probability Options Strategy - Conservative April 2021 777 South Flagler Drive, Suite 800 West Tower • West Palm Beach, FL (United States) • 33401 • (800) 380 - 9342 • service@ZEGAFinancial.com © 20 20 ZEGA Financial. All rights reserved. Recommended Usage The ZEGA High Probability Option Strategy (HiPOS) Conservative is designed to complement or replace an existing aggressive portfolio's allocation. Due to its un - hedged and highly leveraged use of options, we typically recommend the Conservative HiPOS remai n limited to no more than 10 - 20% of an individual's investable assets. This strategy is recommended for use by Accredited Investors. Investors must be aware of the risks in this strategy prior to investment. Risk vs. Return Monthly Performance Strategy Risks & Disclosures Note: Returns are expressed in US Dollars and calculated net of actual fees. Performance includes reinvestment of dividends and other earnings. ZEGA Financial is a registered investment adviser and investment manager that specializes in derivatives. ZEGA is a separate accounts manager and all returns expressed herein are solely from the separate accounts business wit hin ZEGA.

2 The High Probability Options Strateg
The High Probability Options Strategy - Conservative Composite includes all institutional and retail portfolios that deploy deep out of the money credit spreads acro ss the entire portfolio. This strategy targets out of the money strikes that can typically produce target returns of 1% by seeking strikes that are further out - of - the - money than the prior trades deployed by the other prior HiPOS strategies. The strategy aims to deliver risk - adjusted returns that are uncorrelated to the broader markets. A rapidly declining market generally negatively affects the st rategy’s credit put spreads. This composite includes all portfolios that were at least 70% dedicated to this strategy. The benchmark is the CBOE Put Write Index. The CBOE Put Write Index is an index th at measures the performance of a hypothetical portfolio that sells S&P 500 Index (SPX) put options against collateralized cash rese rves held in a money market account. ZEGA Financial claims compliance with the Global Investment Performance Standards (GIPS). To receive a full list of composite descriptions of ZEGA Financial and/or a presentation contact Jay Pestric helli at 1 - 800 - 380 - 9342, ext 101 or jay.pestrichelli@zegafinancial.com . All investments involve the risk of potential investment losses as well as the potential for investment gains. Prior performa nce is n o guarantee of future results and there can be no assurance, and clients should not assume, that future performance of any of the model portfolios will be comparable to past performance. These results should not be viewed as indicative of the advisor’s s kill. The prior performance figures indicated herein represent portfolio performance for only a short time period, and may no t be indicative of the returns or volatility each portfolio will generate over a long time period. The performance presented should also be viewed in the context of the broad market and general economic conditions prevailing during the periods covered by the performance information. The actual results for the comparable periods would als o have varied from the presented results based u pon the timing of contributions and withdrawals from individual client accounts. The performance figures contained herein should be viewed in t he context of the various risk/return profiles and asset allocation methodologies utilized by the asset allocatio n strategists in developing their model portfolios, and should be accompanied or preceded by the model. Standard deviation is a measure of the dispersion of a set of data from its mean. The more spread apart the data, the higher the deviation. In finance, standard deviation is applied to the annual rate of return of an investment to measure the investment's volatility. ZEGA High Probability Options Strategy - Conservative CBOE PUT Write Index Year Jan Feb Mar Apr May Jun Jul Aug Sep Oct Nov Dec YTD CBOE PUT Write Index 2012 - 0.13% 1.26% 1.13% - 1.17% 2013 0.65% 0.86% 1.40% 0.85% - 0.75% 2.58% - 0.28% 1.39% 0.04% 0.49% 0.77% 0.90% 9.23% 12.26% 2014 0.15% 1.48% 1.67% 1.14% 0.42% 0.00% 0.52% 0.48% 0.89% - 4.61% 0.06% 0.99% 3.08% 6.39% 2015 1.36% 1.00% 0.89% 0.16% 0.51% 1.54% 1.22% - 6.53% 1.01% 0.87% - 0.84% 1.11% 2.04% 6.42% 2016 0.56% 0.82% 0.00% 0.41% 0.74% 1.18% - 0.15% 0.26% 1.27% 0.22% 1.56% 0.08% 7.16% 7.75% 2017 0.53% 0.96% 1.58% 0.60% 1.01% 0.40% 0.72% 0.98% - 0.23% 0.96% 0.69% 0.50% 9.04% 10.84% 2018 0.47% 1.10% - 0.47% 3.03% 1.36% 0.26% 1.08% 0.48% 1.20% 0.21% 3.08% - 0.79% 11.50% - 5.89% 2019 1.69% 0.59% 1.21% 0.80% 1.05% 0.90% 0.26% 1.21% 0.09% 0.53% 1.06% 0.78% 10.65% 14.57% 2020 0.74% - 24.50% 19.43% 2.26% 0.90% 1.98% 0.60% 1.35% 2.76% 0.66% 3.04% 2.67% 6.64% 2.11% 2021 0.63% - 1.19% 4.57% 1.26% 5.29% 7.05% 0% 5% 10% 0% 2% 4% 6% 8% 10% 12% 14% ANNUALIZED RETURN ANNUALIZED STANDARD DEVIATION