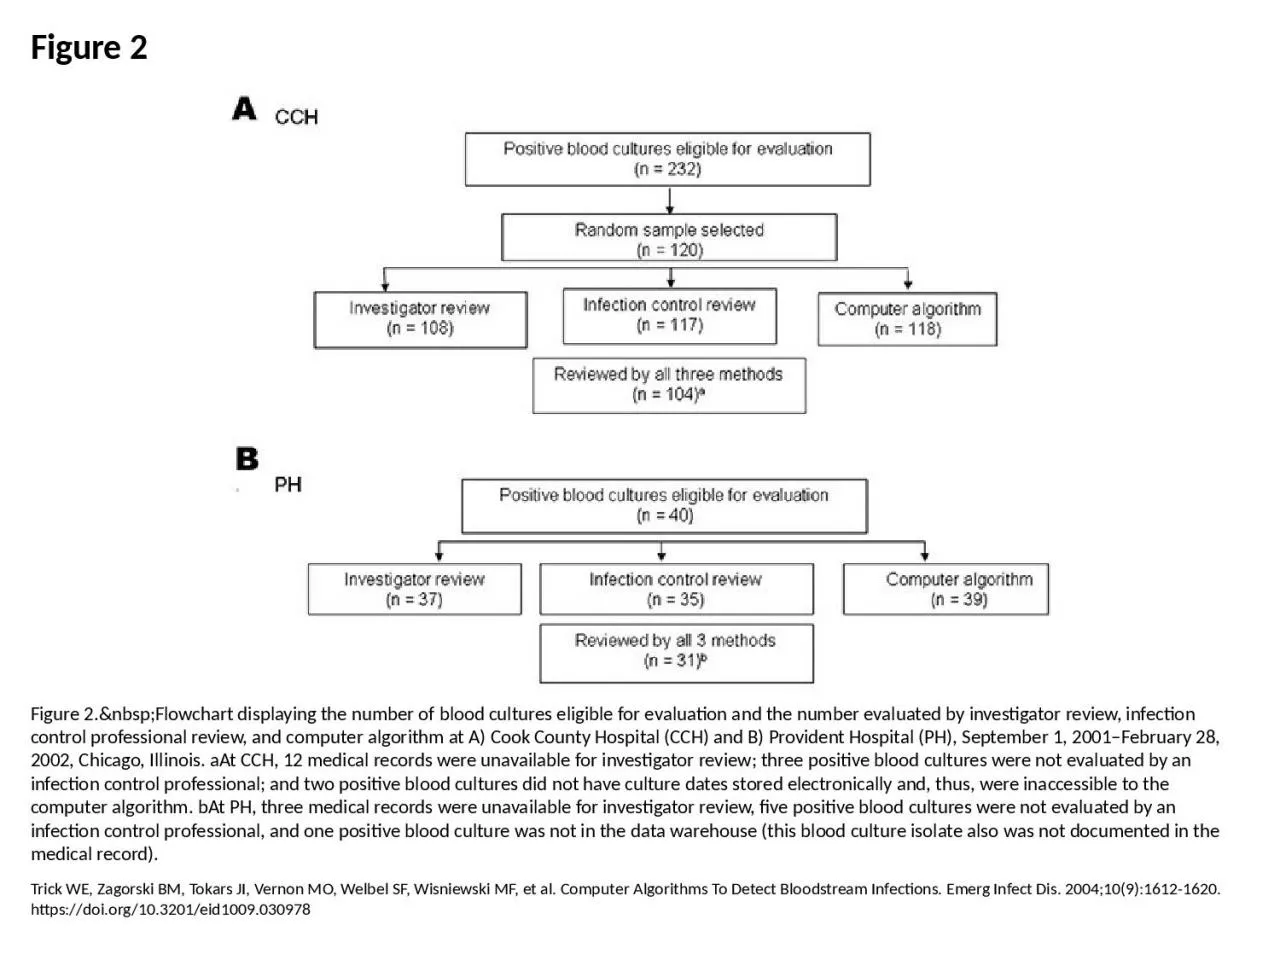
PPT-Figure 2 Figure 2. Flowchart displaying the number of blood cultures eligible
Author : abigail | Published Date : 2023-07-08
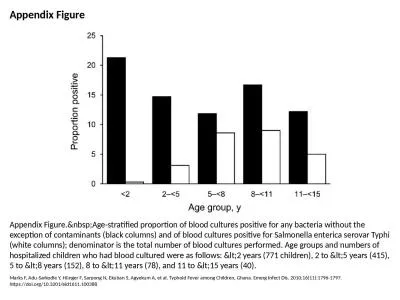
Trick WE Zagorski BM Tokars JI Vernon MO Welbel SF Wisniewski MF et al Computer Algorithms To Detect Bloodstream Infections Emerg Infect Dis 200410916121620 httpsdoiorg103201eid1009030978
Presentation Embed Code
Download Presentation
Download Presentation The PPT/PDF document "Figure 2 Figure 2. Flowchart di..." is the property of its rightful owner. Permission is granted to download and print the materials on this website for personal, non-commercial use only, and to display it on your personal computer provided you do not modify the materials and that you retain all copyright notices contained in the materials. By downloading content from our website, you accept the terms of this agreement.
Figure 2 Figure 2. Flowchart displaying the number of blood cultures eligible: Transcript
Download Rules Of Document
"Figure 2 Figure 2. Flowchart displaying the number of blood cultures eligible"The content belongs to its owner. You may download and print it for personal use, without modification, and keep all copyright notices. By downloading, you agree to these terms.
Related Documents