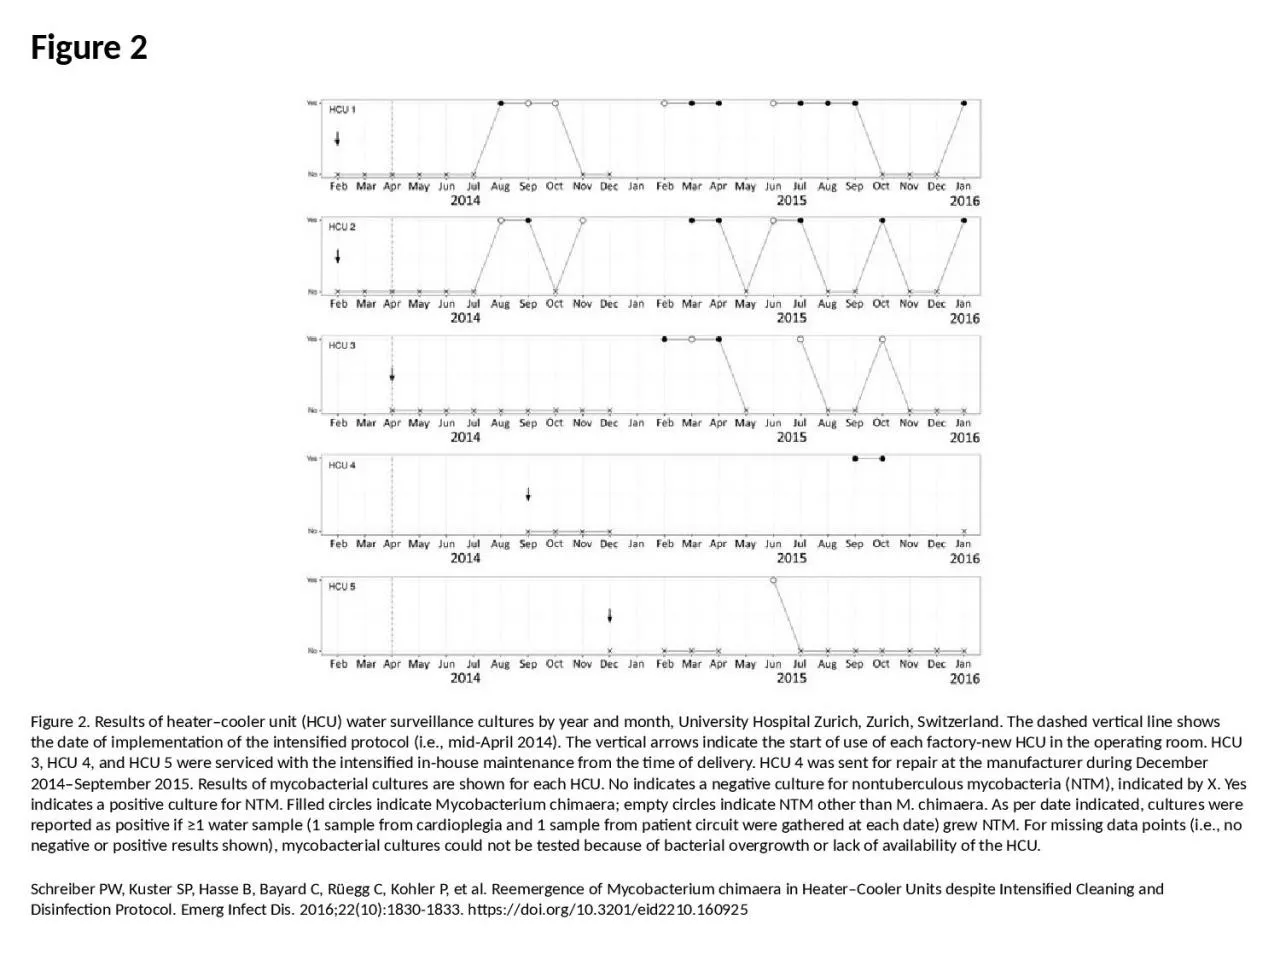
PPT-Figure 2 Figure 2. Results of heater–cooler unit (HCU) water surveillance cultures by
Author : josephine | Published Date : 2024-01-29
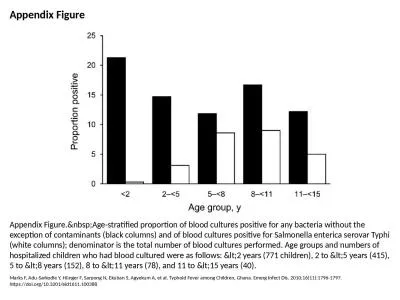
Schreiber PW Kuster SP Hasse B Bayard C Rüegg C Kohler P et al Reemergence of Mycobacterium chimaera in HeaterCooler Units despite Intensified Cleaning and Disinfection
Presentation Embed Code
Download Presentation
Download Presentation The PPT/PDF document "Figure 2 Figure 2. Results of heater–c..." is the property of its rightful owner. Permission is granted to download and print the materials on this website for personal, non-commercial use only, and to display it on your personal computer provided you do not modify the materials and that you retain all copyright notices contained in the materials. By downloading content from our website, you accept the terms of this agreement.
Figure 2 Figure 2. Results of heater–cooler unit (HCU) water surveillance cultures by: Transcript
Download Rules Of Document
"Figure 2 Figure 2. Results of heater–cooler unit (HCU) water surveillance cultures by"The content belongs to its owner. You may download and print it for personal use, without modification, and keep all copyright notices. By downloading, you agree to these terms.
Related Documents