PDF-Creating a Grouped Frequency Distribution Table or Chart with SPSS ...
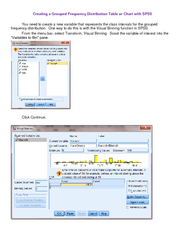
You need to create a new variable that represents the class intervals for the grouped frequency distribution One way to do this is with the Visual Binning function
Download Presentation
"Creating a Grouped Frequency Distribution Table or Chart wit " is the property of its rightful owner. Permission is granted to download and print materials on this website for personal, non-commercial use only, provided you retain all copyright notices. By downloading content from our website, you accept the terms of this agreement.
Presentation Transcript
Transcript not available.