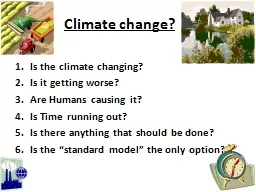
/
Impact of 2000-2050 climate change on Impact of 2000-2050 climate change on

Impact of 2000-2050 climate change on - PowerPoint Presentation

alexa-scheidler
alexa-scheidler . @alexa-scheidler
Follow
399 views
Uploaded On 2017-05-27

Impact of 2000-2050 climate change on - PPT Presentation

PM 25 air quality inferred from a multimodel analysis of meteorological modes Loretta J Mickley CoIs Amos PKA Tai and Daniel J Jacob School of Engineering and Applied Sciences Harvard University ID: 552849

change pm2 climate meteorological pm2 change meteorological climate models tai 2000 modes 2050 µg day period annual variability dominant

Share:

Link:

Embed:

Download Presentation from below link

Download Presentation The PPT/PDF document "Impact of 2000-2050 climate change on" is the property of its rightful owner. Permission is granted to download and print the materials on this web site for personal, non-commercial use only, and to display it on your personal computer provided you do not modify the materials and that you retain all copyright notices contained in the materials. By downloading content from our website, you accept the terms of this agreement.


Presentation Transcript

Slide1

Impact of 2000-2050 climate change on PM2.5 air quality inferred from a multi-model analysis of meteorological modes

Loretta J. Mickley

Co-Is:Amos P.K.A. Tai and Daniel J. JacobSchool of Engineering and Applied SciencesHarvard UniversityAQ Management Contacts:Susan Anenberg and Carey Jang, EPA/OAQPS

1

June 13-15, 2012Slide2

Climate change will likely affect PM2.5 concentrations. Models disagree on the sign and the magnitude of the impacts.

m

g m

-3

m

g m

-3

Racherla

and Adams, 2006

Pye

et al., 2009

Response of sulfate PM

2.5

at the surface to 2000-2050 climate change.

These model results are computationally expensive.

How well do models capture variability in present-day PM2.5?

A2

A1

We need a simple tool that will allow AQ managers to readily calculate the climate consequences for PM2.5 air quality across a range of models and scenarios.

2Slide3

CMIP3 archive of daily meteorology: 15 IPCC models

AQ response to climate change

Apply observed relationships between PM

2.5 and met fields

3

AQ management tool

Climate change over US

PM

2.5

dependence on met variables

Temperature

?

?

?

Stagnation

Relative humidity

Precipitation

Mixing depth

The dependence of PM

2.5

on

meteorological variables

is complex.

Different components have different sensitivities.

Model projections have uncertainties.Slide4

Multiple linear regression coefficients for

total PM2.5 on meteorological

variables. Units: μg m-3 D-1 (p-value < 0.05)

Stagnation is strongly correlated with high PM

2.5

.

Mean PM

2.5

is 2.6

μg m

-3

greater

on a stagnant day

Tai

et al.

2010

Observed correlations of PM

2.5 with temperature and precipitation.

1998-2008 meteorology + EPA-AQS observations

Increases

in total PM

2.5

on a stagnant day vs. a non-stagnant day.

4Slide5

5

P

rincipal component analysis (PCA) of 8 meteorological variables

identifies the dominant meteorological mode driving day-to-day PM

2.5

variability by region:

Midwest, Jan 2006

R

= -0.54

2

1

0

-1

-2

6

3

0

-3

-6

PC

Observed

PM

2.5

g

m

-3

)

Transport modes for PM

2.5

:

Eastern US:

mid-latitude cyclone a

nd cold front passage

Pacific coast:

synoptic-scale maritime inflow

Jan 28

Jan 30

Tai et al., 2012

Dominant

meteorological modes

driving

PM

2.5

variability.Slide6

Fluctuations in the period of the dominant meteorological modes can largely explain interannual variability of PM

2.5

.

Anomalies of annual mean PM2.5

and period of dominant meteorological mode (cyclone passage) for US Midwest

Annual mean PM

2.5

(µg m

-

3

)

Period

Τ

(d)

Tai et al., 2012

R = 0.76

PM

2.5

c

yclone period

T

In each region, we identify the dominant meteorological mode whose mean period

T

is most strongly correlated with annual mean PM

2.5

.

In the Midwest

:

sensitivity

d

PM

2.5

/

d

Τ

=

~1

µg m

-3

d-1 Slide7

2000-2050 climate change leads to increases in

annual mean PM

2.5 across much of the Eastern US, but decreases across the West.

Corresponding change in annual mean PM

2.5

concentrations

m

g m

-3

7

We

apply observed

sensitivity

d

PM

2.5

/

to model change in period DT in each grid box.

There is large variation among model projections.

Change in period

T

of dominant meteorological modes, weighted average for 15 models.

day

D

T

period, 2000-2050

D

PM2.5, 2000-2050

Increased stagnation

Increased maritime inflowSlide8

8

2000-2050 change in annual mean PM

2.5 (µg m-3)Likely responses:Increase of ~0.1 µg m

-3 in eastern US

due

to

increased stagnation

Decrease of ~0.3 µg m

-3

in Northwest

due to more frequent maritime inflows

Models disagree on the sign and magnitude of projected change in annual mean PM2.5, but some patterns emerge.

Northeast

Midwest

Southeast

Great Plains

South-central

Interior NW

Interior SW

Pacific NW

California

Eastern US

NorthwestSlide9

9

Overall climate effect on annual PM

2.5 is likely to be less than ±0.5 µg m-3.Effect of fires

on PM2.5

may

be most important impact in future atmosphere, especially on a daily basis.

Response of PM

2.5

to 2000-2050 climate change

2000-2050 change

in annual mean PM

2.5

(

µg m

-3

)

Circulation

Tai et al., this work

Temperature

Heald

et al, 2008;

Pye

et al., 2009; Tai et al., 2012a

Vegetation

Wu et al., 2012

Wildfires

Spracklen

et al., 2009;

Yue

et al., 2012

East

Northwest

Southeast (OC)

Southeast (nitrate)

Midwest + West (OC)

Northwest (OC + BC)

Tai et al., 2012Slide10

10

Tai, A.P.K., L.J. Mickley, D.J. Jacob, E.M. Leibensperger, L. Zhang, J.A. Fisher, and H.O.T. Pye

, Meteorological modes of variability for fine particulate matter (PM2.5) air quality the United States: implications for PM2.5 sensitivity, Atmos. Chem. Phys., 2012a.Tai, A. P. K., L. J. Mickley, and D. J. Jacob, Impact of 2000-2050 climate change on fine particulate matter (PM

2.5) air quality inferred from a multi-model analysis of meteorological modes, submitted to Atmos. Chem. Phys.,

2012b.

Next steps:

Investigate health impacts of trends in PM

2.5

air quality

and

compare to impacts from

heatwaves

. Proposal submitted to NIH; PI is Francesca Dominici, Harvard.

Develop similar tool for assessing climate impact on U.S. ozone air quality, across multiple models and scenarios. Slide11

11Slide12

Multi-model Projection of

Synoptic Period and PM

2.5

[Tai et al., in prep]

Climatological observation of

d

PM

2.5

/

d

Τ

d

PM

2.5

/

(µg m-3

d-1)

Τ

(d)

∆PM

2.5

(µg m

-3

)

Weighted average 2000-2050 change in

T

(15 IPCC AR4 GCMs)

Resulting 2000-2050 change in PM

2.5

×

=Slide13

Project Roadmap:Identify the main meteorological modes controlling observed PM2.5 across the United States (Tai et al., 2010; 2011)

Calculate the sensitivity of PM2.5 to the frequency of the dominant meteorological mode. (Tai et al., 2011)

Tai, A.P.K., L.J. Mickley, D.J. Jacob, E.M. Leibensperger, L. Zhang, J.A. Fisher, and H.O.T. Pye, Meteorological modes of variability for fine particulate matter (PM2.5) air quality the United States: implications for PM2.5 sensitivity to climate change, submitted to Atmos. Chem. Phys.

, 2011.

Track the changes in these modes using the

IPCC AR4 archive

of climate projections.

Estimate the

change in surface PM2.5

concentrations due to climate penalty (or climate benefit).

IPCC archive of daily meteorology

AQ response to climate change

Main meteorological modes driving observed

PM2.5

13

AQ management toolSlide14

Evaluation of present-day meteorological

m

odes in AR4 climate models reveals differences among models.

Modeled (2 IPCC models) and observed (NCEP/NCAR) 1981-2000 time series of frequency of dominant meteorological mode for PM2.5

in U.S. Midwest

Frequency (d

-1

)

Some models capture both the long-term mean and variability of meteorological mode frequency well.

As a first step, we use only those models that capture present-day mean and variability of frequency to predict future PM

2.5

N42° W87.5°

14

Observed

models