/
2D Image 2D Image

2D Image - PowerPoint Presentation

alida-meadow
alida-meadow . @alida-meadow
Follow
369 views
Uploaded On 2016-03-09

2D Image - PPT Presentation

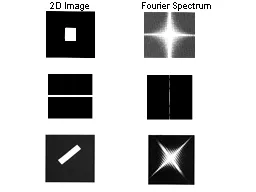
Fourier Spectrum Image Fourier spectrum Fourier Transform Examples Phase and Magnitude Curious fact All natural images have very similar magnitude transform So why do they look different ID: 248690

image average magnitude amp average image amp magnitude noise fourier domain pyramid laplacian phase reconstruction freeman blur projections sample

Share:

Link:

Embed:

Download Presentation from below link

Download Presentation The PPT/PDF document "2D Image" is the property of its rightful owner. Permission is granted to download and print the materials on this web site for personal, non-commercial use only, and to display it on your personal computer provided you do not modify the materials and that you retain all copyright notices contained in the materials. By downloading content from our website, you accept the terms of this agreement.


Presentation Transcript

Slide1

2D Image

Fourier SpectrumSlide2

Image

Fourier spectrum

Fourier Transform -- ExamplesSlide3

Phase and MagnitudeCurious fact

All natural images have very similar magnitude transform.So why do they look different…?

Demonstration

Take two pictures, swap the phase transforms, compute the inverse - what does the result look like?

Phase in images

matters a lot (more than magnitude)Slide4

Slide: Freeman & DurandSlide5

Slide: Freeman & DurandSlide6

Reconstruction with zebra phase, cheetah magnitude

Slide: Freeman & DurandSlide7

Reconstruction with cheetah phase, zebra magnitude

Slide: Freeman & DurandSlide8

ConvolutionSlide9

Spatial Filtering Operations

h(

x,y

) =

1/9 S f(n,m)

(

n,m

) in the 3x3 neighborhoodof (x,y

)

Example

3 x 3Slide10

Salt & Pepper Noise

3 X 3 Average

5 X 5 Average

7 X 7 Average

Median

Noise CleaningSlide11

Salt & Pepper Noise

3 X 3 Average

5 X 5 Average

7 X 7 Average

Median

Noise CleaningSlide12

x derivative

Gradient magnitude

y derivativeSlide13

Vertical edges

Horizontal edges

Edge Detection

ImageSlide14

Convolution Properties

Commutative:f*g = g*fAssociative:(f*g)*h = f*(g*h)Homogeneous:

f*(g)=  f*g

Additive (Distributive): f*(g+h)= f*g+f*hShift-Invariantf*g(x-x0,y-yo)= (f*g) (x-x0,y-yo) Slide15

The Convolution Theorem

and similarly:Slide16

Salt & Pepper Noise

3 X 3 Average

5 X 5 Average

7 X 7 Average

Going back to the Noise Cleaning example…

Convolution with a

rect

 Multiplication with a

sinc

in the Fourier domain

=

LPF

(Low-Pass Filter)

Wider

rect

 Narrower

sinc

=

Stronger

LPFSlide17

What is the Fourier Transform of ?

Examples

*Slide18

Image Domain

Frequency DomainSlide19

The Sampling Theorem

(developed on the board)Nyquist frequency, Aliasing, etc…Slide20

Gaussian pyramids

Laplacian Pyramids Wavelet Pyramids

Multi-Scale Image Representation

Good for:

- pattern matching

- motion analysis

- image compression

- other applicationsSlide21

Image Pyramid

High resolution

Low resolutionSlide22

search

search

search

search

Fast

Pattern MatchingSlide23

The Gaussian Pyramid

High resolution

Low resolution

blur

blur

blur

down-sample

down-sample

down-sample

blur

down-sampleSlide24

expand

expand

expand

Gaussian Pyramid

Laplacian Pyramid

The Laplacian Pyramid

-

=

-

=

-

=Slide25

-

=

Laplacian ~ Difference of Gaussians

DOG = Difference of Gaussians

More details on Gaussian and Laplacian pyramids

can be found in the paper by Burt and Adelson

(link will appear on the website).Slide26

Computerized Tomography (CT)

f(x,y)

u

v

F(u,v)Slide27

Computerized Tomography

Original

(simulated)

2D image

8 projections-

Frequency

Domain

120 projections-

Frequency

Domain

Reconstruction from

8 projections

Reconstruction from

120 projectionsSlide28

End of Lesson...

Exercise#1 -- will be posted on the website.(Theoretical exercise: To be done and submitted individually)