PDF-Course Series Chart When selecting courses with time series assigned t
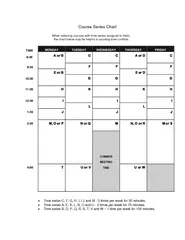
MONDAY TUESDAY WEDNESDAY THURSDAY FRIDAY A or B C
C
A or D C
F
F
E or B E or D G
G
H K
H
K H
M O or P N or Q
M
N O or R M or S
COMMON MEETING T U or V
TIME
Download Presentation
"Course Series Chart When selecting courses with time series " is the property of its rightful owner. Permission is granted to download and print materials on this website for personal, non-commercial use only, provided you retain all copyright notices. By downloading content from our website, you accept the terms of this agreement.
Presentation Transcript
Transcript not available.