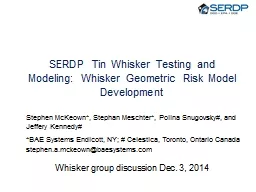
Stephen McKeown Stephan Meschter Polina Snugovsky and Jeffery Kennedy BAE Systems Endicott NY Celestica Toronto Ontario Canada stephenamckeownbaesystemscom Whisker group discussion Dec 3 2014 ID: 775505
Download Presentation The PPT/PDF document " SERDP Tin Whisker Testing and Modeling:..." is the property of its rightful owner. Permission is granted to download and print the materials on this web site for personal, non-commercial use only, and to display it on your personal computer provided you do not modify the materials and that you retain all copyright notices contained in the materials. By downloading content from our website, you accept the terms of this agreement.
Slide1
SERDP Tin Whisker Testing and Modeling: Whisker Geometric Risk Model Development
Stephen McKeown*, Stephan Meschter*, Polina Snugovsky#, and Jeffery Kennedy#*BAE Systems Endicott, NY; # Celestica, Toronto, Ontario Canadastephen.a.mckeown@baesystems.com
Whisker group discussion Dec. 3, 2014
Slide2Tin Whiskers
Electrical short circuits Intermittent if current is more than 10s of mAPermanent if current is less than 10s of mAFound recently in accelerator pedal position sensor (H. Leidecker, L. Panashchenko, J. Brusse, “Electrical Failure of an Accelerator Pedal Position Sensor Caused by a Tin Whisker and Investigative Techniques Used for Whisker Detection” [1])Debris/ContaminationShort circuitsInterferes with optical paths and MEMSMetal Vapor ArcWhisker shorts can vaporize into a conductive plasma able to conduct hundreds of ampshttp://www.calce.umd.edu/tin-whiskers/mva50V70torr.html
2
Slide3Whiskers: Description
Metals that grow whiskers includeTin, Zinc, CadmiumMetallic whiskers are crystalline filamentary structuresGrow outward from metal surfacesMore commonly found in electrodeposited Sn coating and Sn based alloysShapeFilamentsStraightKinkedSpiralNodulesOdd-shaped eruptionsTypical length strongly dependent upon circumstancesNo whiskers, 10 µm, 500 µm, 1 mm, 10 mm, 25 mmTypical thickness – 0.5 to 50 micronsWhisker density varies greatly – no whiskers to over 1000 mm2
3
Slide4SERDP WP1753 Technical objective
Perform systematic tin-whisker testing to improve the reliability of military electronicsProvide an understanding of the key design, manufacturing, and environmental variable combinations that can contribute to whisker growthEvaluate conformal coating for mitigation effectiveness Provide metallurgical analysis of tin whiskers for nucleation and growth-mechanism formulationProvide an analytical framework to assess functional risk of whiskers to military electronic systemsProvide a staged approach to risk modelingPhysical geometry spacing distribution for various lead typesSystem function risk assessment through integration of whisker distribution data and circuit details
4
Slide5Whiskers in Pb-free solder joints
No lead(Pb) in electroplated Sn finish – propensity for whisker formationPoorer wetting – more exposed Sn plating for same type of componentsMore aggressive fluxes to improve wetting – ionic contamination, oxidation and corrosion promoting whisker growthSn-Ag-Cu solder – what about whisker growth?Rough surface – trapped contamination, difficult to clean – higher propensity to whisker
5
top view
Lead-free solder joint roughness, SEM
cross-section
Shrinkage void
Exposed Sn
Solder
Slide6Risk modeling: Gull wing leaded parts
6
Flat pack (leads on 2 sides)
Quad flat pack (leads on 4 sides)
Gull wing parts have among the closest lead-to-lead gap spacing with large opposing source/target areas
Note: Users should NOT
neglect the concern of LARGE SURFACE AREA structures that may be tin or zinc coated. Things such as connector shells, bus bars, RF shields, fasteners, metal can packages,
etc
, provide a much larger surface area from which whiskers may form (i.e., greater opportunity for many whiskers). These are often tin or zinc plated and also used in reasonably close proximity to adjacent shorting sites
Slide7How many leads are there in a box? [3]
One electronic box
Description# of leads# of gapsAnalog 120091787Power Supply326228Digital 125732418CPU11441038CPU-MEZZ25122478
Risk increases with gap quantity
Quad redundant control system
- or -
Fleets
- or -
Vehicles
Slide8How many gaps are there in a function? [3]
8
93
42
76
26
198
14
48
60
18
14
24
3
3
1
1
11
1
4
4
1
1
4
0
50
100
150
200
250
0.170
0.178
0.231
0.269
0.269
0.432
0.762
0.762
0.787
0.787
0.813
Minimum lead gap (mm)
# of components
# of gaps
Count
Circuit card
Gap
435 gaps
19 components
Electronics Box
The majority of the gaps occur
with
fine pitch parts
having the
highest bridging
risk
(e.g. smallest gap spacing)
Part
178 gaps
15 components
Slide9Proximity based whisker bridging risk model
9
First effort [1]
3D to equivalent parallel plate
One whisker characteristic
No conformal coat
Current work
Straight segment 3D
Lead, solder, pad whisker growth regimes
Variable area conformal coat
Multiple part roll-up
Bridging probability (Monte Carlo)
Short circuit probability
Slide10Monte Carlo short circuit modeling approach
10
Conformal coat mitigation
Adjust whisker length, density, and diameter statistics
Modify target area based on coverage dataModify source area based on “tenting” ability of coating
Evaluate overall risk of electrical functional impact
Obtain a probability of each effect
Apply data to a failure modes and effects analysis to determine functional impact
Use model to evaluate bridging risk Select representative digital, analog, and power circuitsCompute total assembly whisker bridging for a give whisker length distribution
Create bridging-risk model for various part typesMonte Carlo developed lead-to-lead spacing distribution for various lead geometries and whisker angle distributionsTime-independent model
Information on whiskers: Length, density, diameter, etc. Data generated herein Published data Time and environment captured in whisker length, density, angle and diameter distributions
Evaluate published data on whisker electrical properties [2]
Slide11Whisker short circuit modeling approach
11
Part type
Part lead and solder geometry data
Create simplified lead/solder geometry model
Determine bridging whisker view factorMonte Carlo analysis used to determine whisker spacing distribution
Whisker length distribution and density [based on: materials (part lead, solder and board pad), environment and exposure time]
Determine whisker bridging probabilityDetermine bridges per lead pair
Determine overall bridging probability
Number of lead pairs
Circuit voltage
Apply electrical conduction distributionObtain total short circuit probability
Conformal coating coverage
Whisker growth angle distribution
INPUTS
SHORT CIRCUIT RISK MODEL
Whisker length independent
Slide12Bridging whiskers
12
Source whisker “sees” the target
Will it hit?
If yes, how long is whisker
Mirror concept reduces geometry related whisker bridging calculation time
Slide13Assumptions
Conservative
Whisker conduction probability is based on gold probe against tin rather than tin-tin contact
Non-conservative
Whiskers from opposite
surfaces
are not interacting
No dueling sabers modeled
Whiskers changing azimuth angle during growth and hitting other whiskers is not modelled
No electric attraction between whiskers and substrates or between whiskers on adjacent surfaces is modeled
Whisker in video is ~ 10 microns in diameter with 50V applied
https://nepp.nasa.gov/whisker/experiment/exp4/index.html
Smaller diameter whisker would require less voltage to move
Longer whisker would be easier to move with a given voltage
Electrostatic charge on the insulator ~couple kV charge
https://nepp.nasa.gov/whisker/video/Zn-whiskers-HDG-electrostatic-bend.wmv
Whiskers are not moving due to air currents
https://nepp.nasa.gov/whisker/video/whisker-motion-air.mpg
Other
Metal
vapor arcing not considered
https://nepp.nasa.gov/whisker/anecdote/2009busbar/index.html
Slide14Bridging risk model
Gull wing
(for QFP, SOT, etc)
Define
geometry
Whisker View Factor:
Probability of an infinitely long whisker bridging from either leadMonte Carlo simulation of whiskers that could bridge from source to target
Input: Source, target and coating geometries and whisker angle and azimuth distributions
Source
Target
area
Bridging
whisker
Non-bridging
whisker
Generate 1,000,000 infinitely long whiskers on source
Example:
QFP Lead
Whisker spacing distribution
Distance from source to target for whiskers that bridge
View factor
160,000 bridge to target (16%)
Whisker angle and azimuth distributions: Uniform (assumption)
840,000 miss
L
L
H
A
L
P
W
L
t
f
W
P
Lead
Solder
Pad
Slide15Modeling: Lead spacing and whisker length
15
Whisker spacing distributions created for various parts
BAE Systems / Celestica © 2013
Whisker length distribution
Lead whisker spacing distribution
(Also done for solder and pad)
Cross correlation of distributions gives whisker bridging probability
Source
Target
Whisker spacing distribution is a cumulative fraction of bridgeable spacing distances relative to nominal spacing
Whisker spacing
to
Nominal spacing ratio
= 1
= 1.2
Whisker angle and azimuth distributions: Uniform (assumption)
Whisker length
Nominal spacing
Ex:
Slide16Modeling: Overall short circuits
16
Whiskerable area for various parts
Shorting probability versus applied voltage
(Courey [5])
1) Whiskers per lead = Whiskerable area x Whisker density
2) Bridges per lead pair = whiskers per lead x whisker view factor (having coating adjustments) x whisker bridging probability
3) Bridges per assembly = Bridges per lead pair x Number of parts x Number of lead spaces
4) Short circuits per assembly = Bridges per assembly + Voltage+ Voltage shorting probability
Slide17Real life considerations: Conductor-to-conductor gap spacing
17
TQFP64 after 4000 hours 85C/85%RH
60 microns
25 % lead overhang
maximum
1.6 mm
Gap spacing reduction by board fabrication etch tolerances, lead misalignment, and a bulbous solder joint
Nominal pad design
228.6 microns
400 micron
pitch
171.4
microns
(Cu thickness = 63 microns)
109 microns
Lead
Pad
J-STD-001 Class 3
assembly allowance
Slide18Real life considerations: Conformal coating coverage
18
Isometric SEM image
The white color in the SEM images indicates that the coating thickness is less than three microns
No coating behind the lead90% front, 50% side and 0% back = 40% uniform coating model value
Conformal coating coverage assessment of low VOC spray coating
Optical image
Slide19SERDP 85 C/85RH HTHH 1,000 vs. 4,000 hrs [4][5]
19
Alloy 42 lead SOT6 with a 0-0
(U65, lead 4)
Copper alloy lead 64 pin quad flat pack (QFP64 U08, lead 28)
1,000 hours
4,000 hours
0-0 contamination
Significant additional nucleation
Slide20Whisker parameters: Length reference distributions
20
Tin source
Thickness (microns)
Substrate
Environmental exposure
Maximum observed whisker length (microns)
Lognormal
µ
(ln mm)
Lognormal
σ
Density
(whiskers
/mm
2
)
SAC305
Solder
[4][5]
3 to 25
Copper board pads
(clean parts and board)
1,000 hours
85°C/85 %RH
76
-4.978
0.710
297 to 1,454
(4,000
hr
level)
3 to 25
Copper board pads
(contaminated parts and board)
186 (Note 1)
-4.795
0.6962
Plated Sn
[6]
5 to 9
Copper C194
2.5 years room,
1,000 cycles -55 to 85°C,
2 months 60°C/85%RH
39
-4.571
0.9866
2,192 to 3,956
7 to 9
Nickel plating over Copper C194
greater than 200 (Note 1)
-4.306
0.8106
126 to 3,573
Plated Sn
Dunn [7] evaluated in [8]
5
Copper plated brass
(specimen 11)
15.5 years: 3.5 years room temp. and humidity, 12 years in a dessicator with dry room air
1,000 maximum specimen 11 length
-2.651
0.9212
Not available
733, average of specimen 11 maximum lengths at various locations
-2.783
0.8592
Slide21Whisker parameters: Density
21
Maximum whisker density at the pad edge is 1454 whiskers/mm2
Soldered area
Unsoldered Lead length
1
2
3
4
5
Whisker count for SOT5 at 0-0 Cleanliness level
4,000
hr
85
C/85RH
85C/85%RH
High whisker density area
Whiskers per
lead on the side
Whisker density (whiskers/mm
2
)
Minimum
0
0
Maximum
44
236
Average
12.9
69
Whiskers per
board pad
Whisker density (whiskers/mm
2
)
Minimum
58
297
Maximum
284
1454
Average
182.8
936
Slide22Example: Geometry inputs
22
Part Drawing Dimensions (mm):
Package Height (A₂) =1.4Package Seating Plane (A₁) =0.1Lead Span (H) =16Body Width (E) =14Lead Foot Length (L) =0.6Lead Thickness (c) =0.145Lead Width (B) =0.18Lead Pitch (e) =0.4Lead Angle From Vertical (α deg) =0Number of Leads =128Number of Sides with Leads =4
PWB Pad Length over Lead Foot Length (mm) =
1.04PWB Pad Width over Lead Width (mm) =0.111Fraction for Minimum Whisker Length Plot (Note 1)=5.00%Fraction for Maximum Whisker Length Plot (Note 1) =90.00%Use Geometric Mean for Midpoints (Note 2)=TRUELead Exit Fraction (*) (of package height) (Note 3) =50%Minimum First Bend Distance (*) (mm) =0.1Pad Spacing Reduction from Solder Bulge (mm) (Note 4) =0.049Relative Height of Bulge (Note 4) =50%Rounding Digits for Prompt Display =4
Default parameters
Lead Spacing (mm) =0.22Solder Spacing (mm) =0.06Pad Spacing (mm) =0.109Lead Thickness/Spacing (non-dim) =0.659Lead Thickness/Solder Spacing (non-dim) =2.417Lead Thickness/Pad Spacing (non-dim) =1.330Lead View Factor Metric (non-dim) =0.260Solder View Factor Metric (non-dim) =0.456Pad View Factor Metric (non-dim) =1.618
Calculated parameters
128 TQFP
Slide23Example: Whisker parameter inputs
23
Lead Whisker Distribution (fill in green highlighted cells as appropriate):
Distribution =2Whisker Density (whiskers/mm2) =69Whiskerable Area =1.460Total Whiskers Generated =100.7Whisker Bridging Fraction =0.00%Whisker View Factor =0.101Coating Effectiveness =0%Total Whiskers Bridging =8.518E-113-Parameter Lognormal Distribution:Whisker Minimum (0) =Whisker µ (location, ln(mm), -1.8965) =-4.795Whisker σ (scale,nondim, 1.5169) =0.6962
Solder Whisker Distribution (fill in green highlighted cells as appropriate):Distribution =2Whisker Density =936Whiskerable Area =0.533Total Whiskers Generated =498.6Whisker Bridging Fraction =0.01%Whisker View Factor =0.2485Coating Effectiveness =0%Total Whiskers Bridging =0.011493-Parameter Lognormal Distribution:Whisker Minimum (0) =Whisker µ (location,ln(mm), -1.8965) =-4.795Whisker σ (scale,nondim, 1.5169) =0.6962
Pad Whisker Distribution (fill in green highlighted cells as appropriate):Distribution =2Whisker Density =936Whiskerable Area =0.311Total Whiskers Generated =291.0Whisker Bridging Fraction =0.00%Whisker View Factor =0.311Coating Effectiveness =0%Total Whiskers Bridging =0.0032753-Parameter Lognormal Distribution:Whisker Minimum (0) =Whisker µ (location,ln(mm), -1.8965) =-4.795Whisker σ (scale,nondim, 1.5169) =0.6962
Lead
Solder
Pad
Slide24Example: Whisker shorting results
24
TQFP128 SAC305 soldered with no conformal coating
Applied voltage of 5 volts Whiskers: 1,000 hour 85C/85%RH exposure with mildly contaminated parts and boards; lognormal µ = -4.795 ln(mm) and σ = 0.6962
Total lead spaces =124Applied Voltage =5VShorting Probability =41.4%Whisker Type:LeadSolderPadBridges per lead:6.24E-060.01150.003275Bridges per part:0.0007741.4250.406Shorts per part:0.000320.5890.168TOTAL SHORTS =0.7577
With two TQFP128 parts a short circuit failure is expected
2 x 0.7577 = 1.5154
Slide25Example: Whisker shorting results
25
Change cleanliness:
1,000 hour 85C/85%RH exposure with clean parts and boards; lognormal µ = -4.978 ln(mm) and σ = 0.710
TOTAL SHORTS =0.373
TQFP128 SAC305 soldered with no conformal coatingApplied voltage of 5 volts Whiskers: 1,000 hour 85C/85%RH exposure with mildly contaminated parts and boards; lognormal µ = -4.795 ln(mm) and σ = 0.6962
TOTAL SHORTS =0.7577
Add coating:40 percent conformal coating coverage
TOTAL SHORTS =0.2486
Change solder, remove coating: TQFP128 tin-lead soldered with no conformal coating Applied voltage of five volts (1,000 hour 85C/85%RH exposure with clean parts and boards; lognormal µ = -4.978 ln(mm) and σ = 0.710).
TOTAL SHORTS =0.00014
Reduce shorts by 1/3
Slide26Summary
Provides a means of comparing various Coating and tin-lead solder mitigations Component geometry types The partitioning of the calculation between the geometry and the whisker distribution allows rapid recalculation of short circuit risk as new whisker distributions become available.
26
Slide27References
[1] S. McCormack and S. Meschter, “Probabilistic Assessment of Component Lead-to-lead Tin Whisker Bridging” SMTA International Conference on Soldering and Reliability, Toronto, Ontario, Canada, May 20-22, 2009. http://nepp.nasa.gov/WHISKER/reference/reference.html [2] K. Courey, et. al, “Tin Whiskers Electrical Short Circuit Characteristics, Part II,” IEEE Trans. on Electronic Packaging Manufacturing, Vol. 32, No. 1, January 2009. http://nepp.nasa.gov/WHISKER/reference/reference.html [3] S. Meschter, S. McKeown, P. Snugovsky, J. Kennedy, and E. Kosiba, Tin whisker testing and risk modeling project, SMTA Journal Vol. 24 Issue 3, 2011 pp. 23-31.[4] S. Meschter, P. Snugovsky, J. Kennedy, Z. Bagheri, S. Kosiba; “SERDP Tin Whisker Testing and Modeling: High Temperature/High Humidity (HTHH) Conditions”; Defense Manufacturers Conference (DMC) December 2-5, 2013 Orlando, Florida[5] S. Meschter, P. Snugovsky, J. Kennedy, Z. Bagheri, E. Kosiba, and A. Delhaise, SERDP Tin Whisker Testing and Modeling: High Temperature/High Humidity Conditions, International Conference on Solder Reliability (ICSR2013), Toronto, Ontario, Canada. May 13-15, 2014.[6] Panashchenko, Lyudmyla; “Evaluation of Environmental Tests for Tin Whisker Assessment”; University of Maryland, Master’s thesis 2009[7] Dunn, “15½ Years of Tin Whisker Growth – Results of SEM Inspections Made on Tin Electroplated C-Ring Specimens,” ESTEC Materials Report 4562, European Space Research and Technology Centre Noordwijk, The Netherlands; March 22, 2006[8] McCormack, Meschter, “Probabilistic assessment of component lead-to-lead tin whisker bridging,” International Conference on Soldering and Reliability, Toronto, Ontario, Canada, May 20-22, 2009
27