/
Extended Data Figure 1. Extended Data Figure 1.

Extended Data Figure 1. - PowerPoint Presentation

amelia
amelia . @amelia
Follow
27 views
Uploaded On 2024-02-02

Extended Data Figure 1. - PPT Presentation

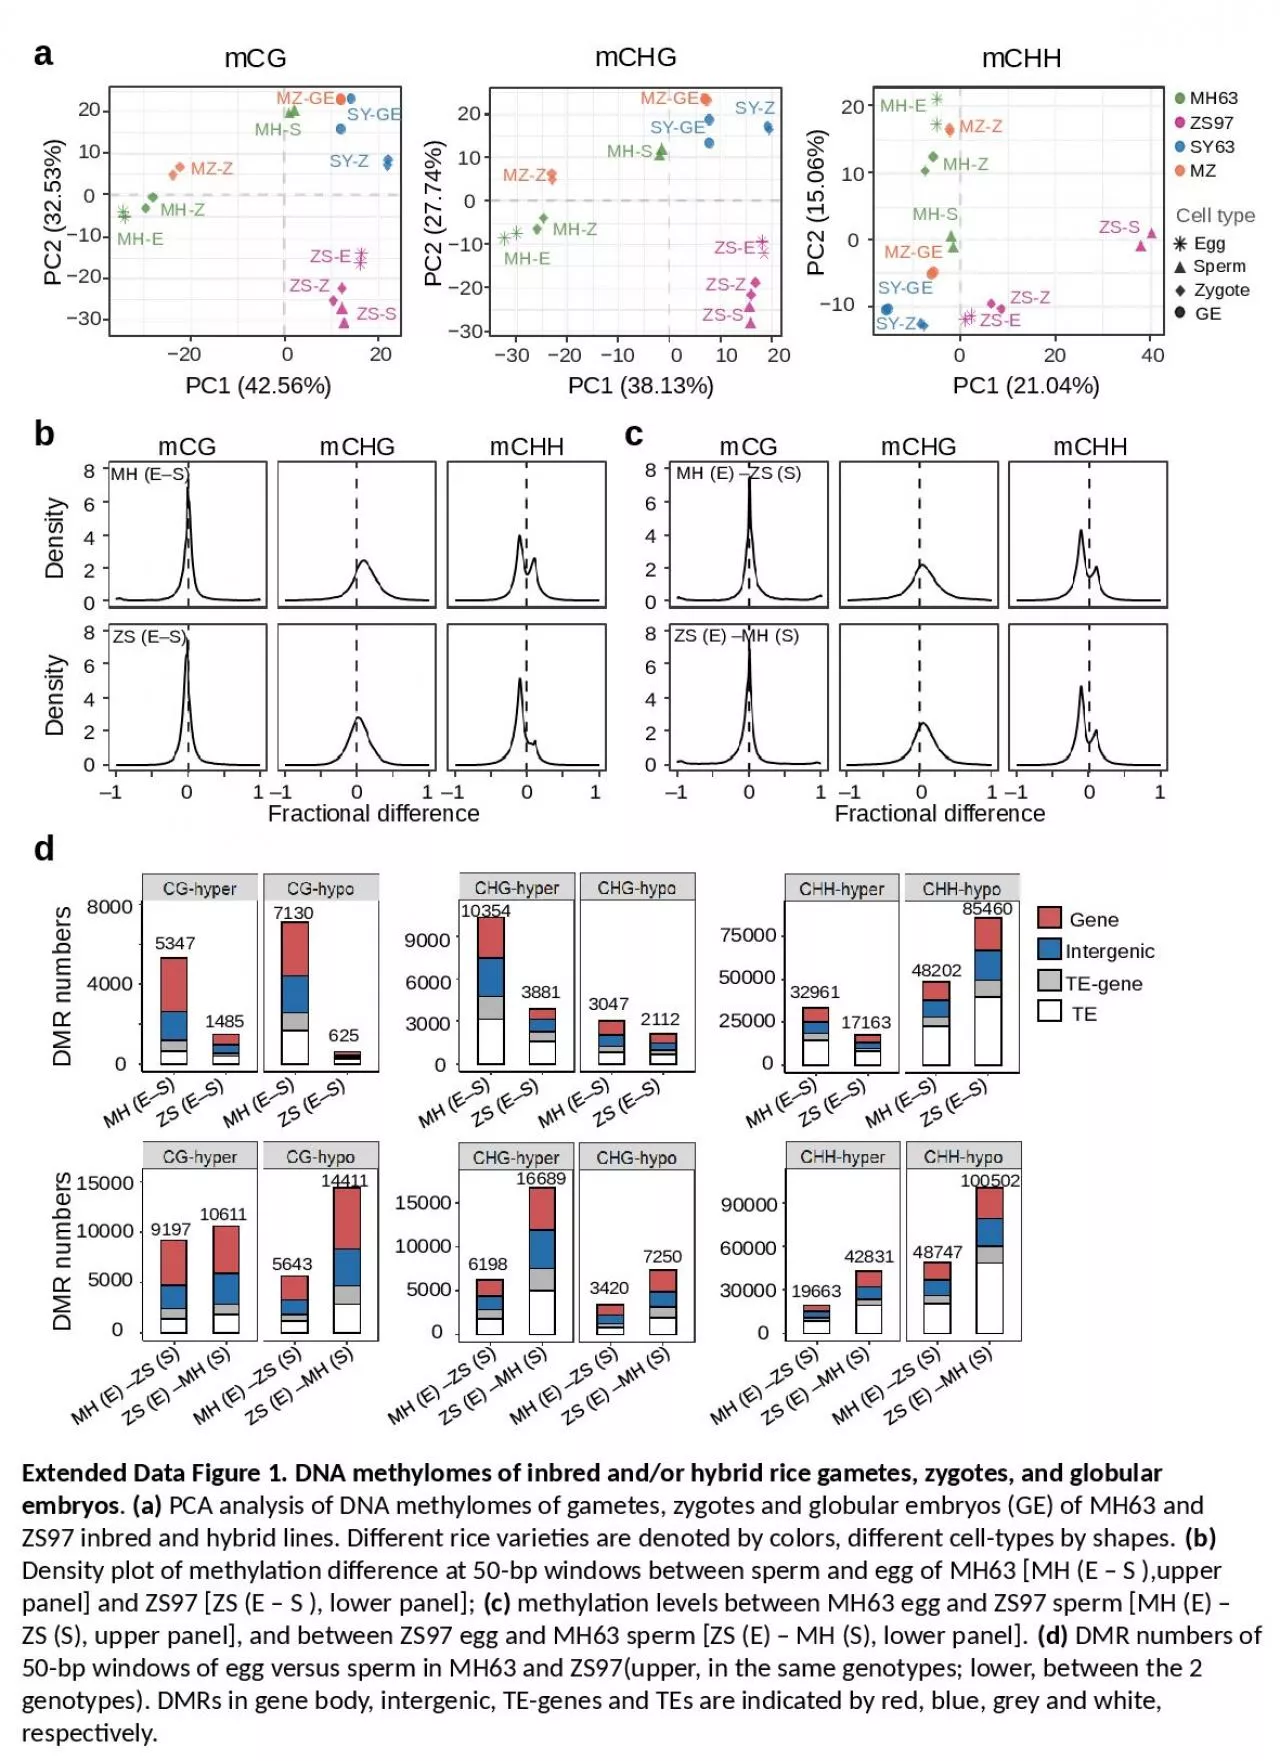
DNA methylomes of inbred andor hybrid rice gametes zygotes and globular embryos a PCA analysis of DNA methylomes of gametes zygotes and globular embryos GE of MH63 and ZS97 inbred and hybrid lines Different rice varieties are denoted by colors different celltypes by shapes ID: 1044171

nip 9311 egg dmrs 9311 nip dmrs egg zygote sperm zs97 mh63 sy63 zygotes methylation hybrid showing data specific

Share:

Link:

Embed:

Download Presentation from below link

Download Presentation The PPT/PDF document "Extended Data Figure 1." is the property of its rightful owner. Permission is granted to download and print the materials on this web site for personal, non-commercial use only, and to display it on your personal computer provided you do not modify the materials and that you retain all copyright notices contained in the materials. By downloading content from our website, you accept the terms of this agreement.


Presentation Transcript

1. Extended Data Figure 1. DNA methylomes of inbred and/or hybrid rice gametes, zygotes, and globular embryos. (a) PCA analysis of DNA methylomes of gametes, zygotes and globular embryos (GE) of MH63 and ZS97 inbred and hybrid lines. Different rice varieties are denoted by colors, different cell-types by shapes. (b) Density plot of methylation difference at 50-bp windows between sperm and egg of MH63 [MH (E ̶ S ),upper panel] and ZS97 [ZS (E ̶ S ), lower panel]; (c) methylation levels between MH63 egg and ZS97 sperm [MH (E) ̶ ZS (S), upper panel], and between ZS97 egg and MH63 sperm [ZS (E) ̶ MH (S), lower panel]. (d) DMR numbers of 50-bp windows of egg versus sperm in MH63 and ZS97(upper, in the same genotypes; lower, between the 2 genotypes). DMRs in gene body, intergenic, TE-genes and TEs are indicated by red, blue, grey and white, respectively.abcdPC2 (32.53%)PC1 (42.56%)−20 0 20−30−20−1010200ZS-SZS-ZZS-ESY-ZSY-GEMZ-GEMH-SMZ-ZMH-ZMH-EmCG01020−10 0 20 40SY-GEMZ-GESY-ZMH-ZMZ-ZZS-ZZS-EMH-SZS-SMH-EPC1 (21.04%)PC2 (15.06%)mCHH−30−20−1001020−30 −20 −10 0 10 20MH-EMH-ZMZ-ZMH-SMZ-GESY-GESY-ZZS-EZS-ZZS-SPC2 (27.74%)PC1 (38.13%)mCHGMH63MZSY63ZS97Cell typeEggGESpermZygoteFractional differencemCGmCHGmCHHDensityDensityMH (E–S)42086–101–101–101ZS (E–S)42086Fractional differencemCGmCHGmCHHMH (E) –ZS (S)42086–101–101–101ZS (E) –MH (S)42086DMR numbersTETE-geneGeneIntergenic800040000MH (E ̶ S)ZS (E ̶ S)MH (E ̶ S)ZS (E ̶ S)5347713014856257500050000250000MH (E ̶ S)ZS (E ̶ S)MH (E ̶ S)ZS (E ̶ S)32961482021716385460MH (E ̶ S)ZS (E ̶ S)MH (E ̶ S)ZS (E ̶ S)900060003000010354304738812112DMR numbersMH (E) ̶ ZS (S)ZS (E) ̶ MH (S)MH (E) ̶ ZS (S)ZS (E) ̶ MH (S)150001000050000919710611564314411MH (E) ̶ ZS (S)ZS (E) ̶ MH (S)MH (E) ̶ ZS (S)ZS (E) ̶ MH (S)150001000050000619816689342072509000060000300000MH (E) ̶ ZS (S)ZS (E) ̶ MH (S)MH (E) ̶ ZS (S)ZS (E) ̶ MH (S)196634283148747100502

2. Extended Data Figure 2. DNA methylation in the gametes and zygotes of the hybrid parental lines. (a) Boxplots showing the CG, CHG, and CHH methylation levels in genes and transposable elements (TEs) of sperm (S), egg (E) and zygote (Z) cells of the MH63 and ZS97 varieties. Values are averages from the two replicates. (b) Density plot showing the frequency distribution of methylation difference at 50-bp windows between zygote and egg (Z – E) and between zygote and sperm (Z – S) in MH63 (MH) and ZS97 (ZS). (c) Differentially methylated regions (DMRs) between zygote and egg (Z – E), and between zygote and sperm (Z – S) in MH63 (upper panel) and ZS97 (lower panel). DMRs numbers and distributions (gene body, red; intergenic, blue; TE-genes, grey; and TE, white) are indicated.abcTEGenemCG1.000.20.40.60.81.000.20.40.60.8mCHG0.200.1000.250.150.051.000.20.40.60.8mCHHSEZSEZSEZSEZ0.1000.020.040.060.08MH63ZS970.500.10.20.30.4Fractional differencemCG mCHG mCHH Density Density DensityDensityMH (Z–E)4206420MH (Z–S)420ZS (Z–E)–110–110–110420ZS (Z–S)TETE-geneGeneIntergenicMH63DMR numbers1200006000300090003855384106851970060003000900012561024641305852040000200006000021618343032698961451DMR numbersZ–EZ–SZ–EZ–S3000200001000409101129412010Z–EZ–SZ–EZ–S600004000002000042705181743100665760ZS97Z–EZ–SZ–EZ–S60004000020002101271363423265MH63ZS97

3. Extended Data Figure 3. Conserved DMRs between inbred and hybrid zygotes relative to the gametes. (a) Venn diagrams showing the overlapping of hyper DMRs between hybrid zygotes (MZ zygote [MZ (Z)], SY63 zygote [SY (Z)]) and inbred zygotes (ZS97 zygote [ZS (Z)], MH63 zygote [MH (Z)]) versus female gametes (ZS97 egg [ZS (E)], MH63 egg [MH (E)]); (b) overlapping of hyper DMRs between hybrid zygotes (MZ zygote [MZ (Z)], SY63 zygote [SY (Z)]) and inbred zygotes (ZS97 zygote [ZS (Z)], MH63 zygote [MH (Z)]) versus male gametes (ZS97 sperm [ZS (S)], MH63 sperm [MH (S)]). (c) Numbers of the overlapping hyper DMRs between hybrid zygote and inbred zygote versus gametes. DMRs in gene body, intergenic, TE-gene and TE regions are denoted by red, blue, grey and white, respectively.abcMZ (Z) – MH (E)Zygote vs EggMH (Z) – MH (E)SY (Z) – ZS (E)ZS (Z) – ZS (E)1991805902651382664CG362861223374912979001CHG(52.5%)(65.8%)(29.6%)(36.6%)MZ (Z) – ZS (S)ZS (Z) – ZS (S)SY (Z) – MH (S)MH (Z) – MH (S)533465115752198297313935CG1021162692894293567226528CHG(53.4%)(42.5%)(38.6%)(43.1%)Zygote vs SpermTETE-geneGeneIntergenicNumber of DMRs025001992655332198Hyper CG DMRMZ (Z) – MH (E) SY (Z) – ZS (E) MZ (Z) – ZS (S) SY (Z) – MH (S) 0500036274910214293Number of DMRsHyper CHG DMRMZ (Z) – MH (E) SY (Z) – ZS (E) MZ (Z) – ZS (S) SY (Z) – MH (S)

4. Extended Data Figure 4. Zygotic methylation levels of the egg versus sperm DMRs in MH63 and ZS97. Boxplots and heatmaps showing the methylation levels of the egg-sperm DMRs in egg, sperm, and zygote of MH63 (a) and ZS97 (b). The numbers (N) of DMRs between egg and sperm at CG, CHG, and CHH contexts are indicated.abMH63mCHGmCGmC10.50mCHHEggSpermZygote10.50EggSpermZygoten = 5347n = 713010.50EggSpermZygoteEggSpermZygoten = 10354n = 304710.50EggSpermZygoteEggSpermZygoten = 32961n = 48202ZS97EggSpermZygoteEggSpermZygote10.50n = 85460n = 17163EggSpermZygoteEggSpermZygote10.50n = 1485n = 625EggSpermZygoteEggSpermZygote10.50n = 3881n = 2112mCHGmCGmCHH

5. Extended Data Figure 5. Maintenance of parental allelic-specific methylations in the reciprocal hybrids of NIP and 9311. Boxplots and heatmaps showing the paternal and maternal methylation levels of the DMRs between Nip and 9311 in the reciprocal hybrids N9 (Nip×9311, Nip as female and 9311 as male) and 9N (9311×Nip, 9311 as female and Nip as male). N9 (9311) indicated paternal-allele-specific methylation in NIP×9311, N9 (Nip) indicated maternal-allele-specific methylation in Nip×9311, 9N (Nip) indicate paternal-allele-specific methylation in 9311×Nip, 9N (9311) indicate maternal-allele-specific methylation in 9311×Nip. The numbers (N) of the hyper (9311 > Nip) or hypo (9311 < Nip) DMRs between 9311 and Nip at CG, CHG and CHH contexts are indicated. 10.509311NipN9 (9311)N9 (Nip)N99N (9311)9N (Nip)9N9311NipN9 (9311)N9 (Nip)N99N (9311)9N (Nip)9NCG DMRs(n = 9315)9311 > NIP(n = 5858)9311 < NIP10.509311NipN9 (9311)N9 (Nip)N99N (9311)9N (Nip)9N9311NipN9 (9311)N9 (Nip)N99N (9311)9N (Nip)9NCHG DMRs(n = 6482)9311 > NIP(n = 6220)9311 < NIP10.509311NipN9 (9311)N9 (Nip)N99N (9311)9N (Nip)9N9311NipN9 (9311)N9 (Nip)N99N (9311)9N (Nip)9NCHH DMRs(n = 9824)9311 > NIP(n = 9250)9311 < NIPmC10.50

6. Extended Data Figure 6. Parental allelic-specific methylations associated with specific histone marks in the parental lines. (a, b) H3K27ac, H3K4me3 and H3K9me2 modifications of the CG (a) and CHG (b) DMRs between MH63 egg and ZS97 sperm MH63 and ZS97 seedlings, upper panel indicate the hyper DMRs (MH63 Egg > ZS97 Sperm), lower panel indicate the hypo DMRs (MH63 Egg < ZS97 Sperm). (c, d) Genome browser screenshots showing the paternal (pat) and maternal (mat) allelic-specific methylation in hybrid SY63 zygote and globular embryo (GE) and H3K4me3 in MH63, ZS97, and SY63 seedling (Se) of the CG hyper (c) and hypo (d) DMRs between MH63 sperm and ZS97 egg. ZS egg (ZS-E), MH sperm (MH-S), SY63 Zygote (SY-Z), SY63 globular embryo (SY-GE), maternal (mat) and paternal (pat) alleles of SY63 Zygote, GE, and seedling (Se). H3K4me3 ChIP-seq signal (RPKM scale 0 to 600). Magenta for data from ZS97, Green for data from MH63.ab120404030120207040Centre–2Kb2KbCentre–2Kb2KbH3K27acH3K4me3H3K9me2Egg (MH) > Sperm (ZS)Egg (MH) < Sperm (ZS)MH ZSRelative enrichmentCG-DMRs (n = 8,850) CG-DMRs (n = 5,487) Egg (MH) > Sperm (ZS)Egg (MH) < Sperm (ZS)8020Centre–2Kb2KbCentre–2Kb2Kb802060206020MH ZSRelative enrichmentCHG-DMRs (n = 6,063) CHG-DMRs (n = 3,319) H3K27acH3K4me3H3K9me2OsMH_01G0376900Chr01:24213400-24213900ZS-EMH-SSY-ZygotematpatSY-ZSY-GEmatpatSY-GEZS-SeMH-SematpatSY-SeOsMH_01G0571900Chr01:36422650-36422950OsMH_02G0153200Chr02:9518400-9518600mCGH3K4me3OsMH_06G0112400Chr06:6537100-6537250OsMH_08G0251900Chr08:17448700-17449050OsMH_10G0292500Chr10:19591150-19591500OsMH_07G0176500Chr07:10018850-10019100mCGH3K4me3OsMH_09G0103900Chr09:6781250-6781700ZS-EMH-SSY-ZygotematpatSY-ZSY-GEmatpatSY-GEZS-SeMH-SepatSY-Sematcd

7. Extended Data Figure 7. H3K4me3 levels of the DMRs between NIP and 9311 in the parental lines and the reciprocal hybrids. H3K4me3 levels of the CG (a), CHG (b), and CHH (c) DMRs between 9311 and NIP in 9311, NIP, 9311×NIP and NIP×9311 plants. Upper panels, hyper-DMRs (9311 > NIP); lower panels, hypo-DMRs (9311 < NIP). In the hybrids, the parental allele-specific H3K4me3 levels are shown.abc4209311NIP9311×NIPNIP×9311CG-DMRs (n = 77,701)CG-DMRs (n = 59,895)9311NIP3201–2Kb2KbCentreCentre2Kb–2KbH3K4me3 relative enrichment9311 > NIP9311 < NIP420CHG-DMRs (n = 44,899)CHG-DMRs (n = 41,477)9311NIP3201Centre2Kb–2KbCentre2Kb–2KbH3K4me3 relative enrichment9311NIP9311×NIPNIP×93119311 > NIP9311 < NIP3201420Centre2Kb–2KbCentre2Kb–2KbCHH-DMRs (n = 38,352)CHH-DMRs (n = 22,968)9311NIPH3K4me3 relative enrichment9311NIP9311×NIPNIP×93119311 < NIP9311 > NIP

8. Extended Data Figure 8. Transcriptomic analysis of the reciprocal hybrid zygotes. (a) Heatmap and Spearman coefficients of RNA-seq replicates of MH63 sperm (MH-S) and egg (MH-E), ZS97 sperm (ZS-S) and egg (ZS-E), SY63 zygote (SY-Z) and globular embryo (SY-GE), and MZ zygote (MZ-Z) and globular embryo (MZ-GE). Three biological replicates are shown. (b) PCA analysis of transcriptomes of MH63 and ZS97 sperm and egg cell and the reciprocal hybrids (SY63 and MZ) zygotes as well as globular embryos. For each sample, three biological replicates were produced. (c) Volcano-plot showing the differentially expressed genes (DEGs) identified in SY63 zygote versus ZS97 egg (upper), MZ zygote versus MH63 egg (lower). |log2 (Fold Change)| > 1 and p-adj < 0.01. (d) Venn diagrams and GO enrichment analysis of the commonly up-regulated (n = 601) and downregulated (n = 684) genes in hybrid zygotes versus eggs (SY63 zygote versus ZS97 egg and MZ zygote versus MH63 egg). ZS-S1ZS-S2ZS-S3MH-S1MH-S2MH-S3SY-GE3SY-GE1SY-GE2MH-E1MH-E2MH-E3ZS-E3ZS-E1ZS-E2SY-Z1SY-Z2SY-Z3MZ-GE3MZ-GE1MZ-GE2MZ-Z3MZ-Z1MZ-Z2ZS-S1ZS-S2ZS-S3MH-S1MH-S2MH-S3SY-GE3SY-GE1SY-GE2MH-E1MH-E2MH-E3ZS-E3ZS-E1ZS-E2SY-Z1SY-Z2SY-Z3MZ-GE3MZ-GE1MZ-GE2MZ-Z3MZ-Z1MZ-Z210.60.80.50.70.9bcd7550250–250–20–102010PC1 (81%)PC2 (9%)EggGESpermZygoteZS97SY63MZMH63aSY-Z vs. ZS-EMZ-Z vs. MH-E–log10 (padj)0–5–1051061186636log2 (Fold Change)200015010050219926110–5–10510ethylene−activated signaling pathwayDNA replicationDNA unwinding involved in DNA replicationprogrammed cell deathDNA replication initiationmicrotubule cytoskeleton organizationDSB repair via break-induced replicationcalcium-mediated signalingmitotic cell cyclecell morphogenesisfemale meiotic nuclear division01234−log10 (P-value)20106035601SY-Z up(2611)MZ-Z up(6636)protein−chromophore linkagephotosynthesisphotosynthesis, light harvesting in PS Icircadian rhythmprotein refoldingphotosynthesis, light harvestinghexose metabolic processresponse to heatL−arabinose metabolic processPS II assembly4620−log10 (P-value)68515155434SY-Z down(2199)MZ-Z down(6118)

9. Extended Data Figure 9. Analysis of hybrid zygote transcriptomes. (a) Upset-plot showing the overlapping up-regulated genes in Kitaake (Kita-Z, Anderson et al., 2017), Nipponbare (Nip-Z, Rahman et al., 2019), Donjin (DJ-Z, Zhou et al., 2021), SY63 (SY-Z) and MZ (MZ-Z) zygotes versus egg. (b) Heatmap showing the zygotic expressed genes (n = 601, up-regulated genes in the zygotes versus egg) commonly detected in SY63 and MZ zygotes. abKita-Z_upNip-Z_upDJ-Z_upSY-Z_upMZ-Z_up6000030000150030004500–110Z-scoreNipSY63MZKitaakeMH-SSY-ZZS-EZS-SMZ-ZMH-ENip-SNip-ZNip-EKita-SKita-ZKita-EPOLD1PHI1HTA710/H2AMEL1/AGOMCM6CENH3HOX2CycB2.2H2A.6RLCK153KRP1HOP2POLA4OsMET1bRNRS2AGP7HTB712H2A.8RBOHIMCM10OsGCS1LTET12OsCMT3aCIPK16OsDRW1SAUR33OsWD40-20WOX5H2A.5CML12RBOHAH2B.10OsHDA714MCM7CDPK2LEA9RALF3H2B.5IAA30Cluster 1Cluster 2Cluster 3

10. Extended Data Figure 10. DNA methylation levels of the maternal expressed genes (MEG) in the reciprocal hybrid zygotes. (a) Percentages of the paternal and maternal allelic-specific reads separated from the hybrid zygotes (upper, SY63, lower, MZ). (b) Heatmap showing expression patterns of the MEGs identified in reciprocal hybrid zygotes. (c) Metaplots showing DNA methylation levels of the zygotic MEGs (n = 1063) in parental gametes (MH63 egg [MH-E], ZS97 sperm [ZS-S], ZS97 egg [ZS-E], MH63 sperm [MH-S]). (d) Violin plots showing the CHH methylation of the zygotic MEGs (n = 1063) at promoter regions in parental gametes. P-value is calculated by the two-tail t-test. (e) Metaplots showing the parental allelic-specific methylation of the zygotic MEGs at CHH context in SY63 and MZ zygotes. adcMZ00.15-2kbTSSTES2kb00.6-2kbTSSTES2kbSY6300.60.40.200.40.200.15-2kbTSSTES2kb00.80.4MH-EZS-SZS-EMH-SmCHGmCGmCHHMZSY6300.4MaternalPaternal-2kbTSSTES2kbmCHH-2kbTSSTES2kb00.150.050.10mCHH of MEGs promoter9.3e−085.4e−0900.20.40.6MH-E ZS-SZS-EMH-Se10.50– 0.5– 1Z-scoreMEGs (1063)ZS-EMH-SSY-ZSY(mat)SY(pat)MH-EZS-SMZ-ZMZ(mat)MZ(pat)SY63 ZygoteMZ Zygoteb

11. Extended Data Figure 11. Identification of PEGs and MEGs in the reciprocal hybrid globular embryos. (a) Heatmap showing the paternal allelic-specific expressed genes (P-ASEGs; SY63 [n = 903], MZ [n = 1150]) and (b) maternal allelic-specific expressed genes (M-ASEGs; SY63 [n = 1883], MZ [n = 1680]) in hybrid globular embryos (GEs). (c) Identification of GE PEGs and MEGs by scattering analysis of the paternal ASE genes in the reciprocal hybrids (SY63 and MZ). (d) Venn diagrams showing the overlapped PEGs and MEGs between zygotes and GEs in SY63 and MZ. (e) Heatmap showing the expression patterns of the DNA methyltransferase genes (CMT3a/b, MET1b, KYP, DRM2, DDM1a/b) in gametes and the reciprocal hybrid zygotes of MH63 and ZS97. Three replicates are shown. (f) Gene expression levels of DNA methylation –related enzymes (CMT3a/b, MET1b, KYP, DRM2, DDM1a/b) in rice sperm, egg, and zygote (2.5 hap, 5 hap, 9 hap) RNA-seq data reported by Anderson et al., (2017). Error bars indicate means ± SD (n = 3). cd66GE-PEGs(102)Zygote-MEGs(1063)GE-MEGs (350)Zygote-PEGs (28)931963600000280254000PEGMEGMH or ZS enrichedOtherGE20-2010-10020-2010-100182350313102log2(SYzs97/SYmh63)log2(MZzs97/MZmh63)SY (GE) P-ASEGs (903)MZ (GE) P-ASEGs ( 1150)ZS-EMH-SSY-GESY (mat)SY (pat)MH-EZS-SMZ-GEMZ (mat)MZ (pat)SY (GE) M-ASEGs (1883)MZ (GE) M-ASEGs (1680)ZS-EMH-SSY-GESY (mat)SY (pat)MH-EZS-SMZ-GEMZ (mat)MZ (pat)10.50– 0.5– 1Z-scoreabSpermEggZygoteCMT3aCMT3bMET1bSDG714/KYPDRM2DDM1aDDM1bMH63ZS97MH63ZS97SY63MZ123123123123123123Z-score20-2efCMT3aCMT3bMET1bSDG714/KYPDRM2OsDDM1aOsDDM1b0100200300400SpermEgg2.5h Zygote5h Zygote9h ZygoteTPM