/
29.534 Fat type Cohorts, diet 29.534 Fat type Cohorts, diet

29.534 Fat type Cohorts, diet - PowerPoint Presentation

amey
amey . @amey
Follow
342 views
Uploaded On 2022-06-14

29.534 Fat type Cohorts, diet - PPT Presentation

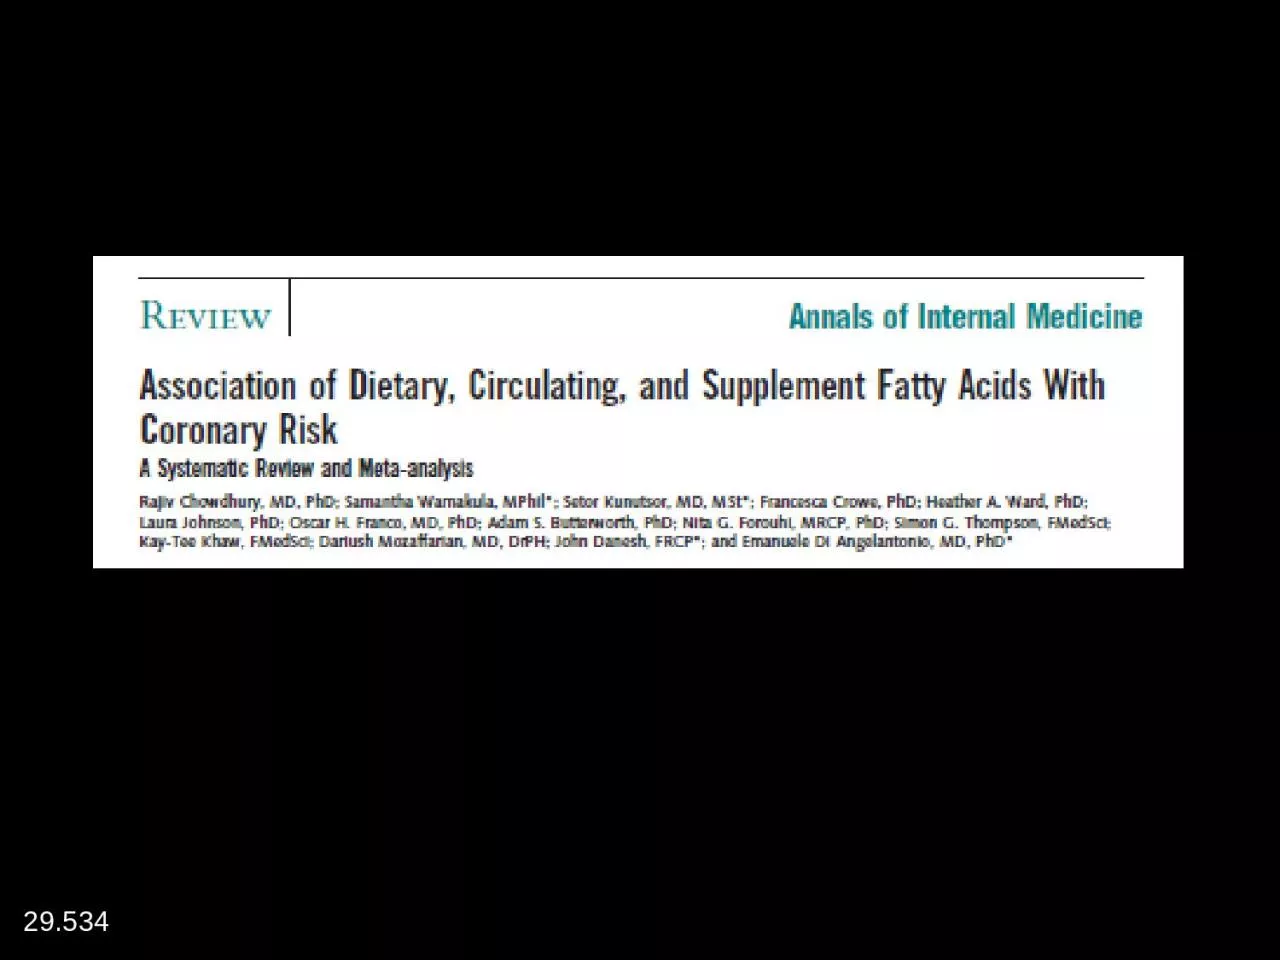
Cohorts blood Randomized trials Saturated RR 102 097107 RR 106 086130 Monounsat RR 099 089109 RR 106 097117 N6 polyunsat RR 101 096107 ID: 917755

000 fat fats diet fat 000 diet fats chowdhury yugoslavia year studies coronary keys incidence finland calories high polyunsaturated

Share:

Link:

Embed:

Download Presentation from below link

Download Presentation The PPT/PDF document "29.534 Fat type Cohorts, diet" is the property of its rightful owner. Permission is granted to download and print the materials on this web site for personal, non-commercial use only, and to display it on your personal computer provided you do not modify the materials and that you retain all copyright notices contained in the materials. By downloading content from our website, you accept the terms of this agreement.


Presentation Transcript

Slide1

29.534

Slide2

Fat type

Cohorts, diet

Cohorts, bloodRandomized trialsSaturatedRR = 1.02 ( 0.97-1.07)RR = 1.06 (0.86-1.30)MonounsatRR = 0.99 (0.89-1.09)RR = 1.06 (0.97-1.17)N-6 polyunsatRR = 1.01 (0.96-1.07)RR = 0.94 (0.84-1.06)RR = 0.89 (0.71-1.12)N-3 polyunsat (long chain)RR = 0.93 (0.84-1.02)RR = 0.84 (0.63-1.11)RR = 0.94 (0.86-1.03)TransRR = 1.16 (1.06-1.27)RR = 1.05 (0.76-1.44)

Results from Chowdhury et al. (from Abstract)(RRs and 95% CIs for highest vs lowest category)

9.260

Slide3

Conclusion from Chowdhury Abstract

“Current evidence does not clearly support cardiovascular guidelines that encourage high consumption of polyunsaturated fatty acids and low consumption of total saturated fats.”

(Chowdhury R. et al. Ann Intern Med 2014:160:398-406)

Slide4

Mark

Bittman

Butter is BackMarch 25, 2014Julia Child, goddess of fat, is beaming somewhere.29.533

Slide5

Comprehensive look at multiple fats

Inclusion of cohort studies of diet and biomarkers and randomized trials

Based on “hard endpoints”Consistent methods across dietary fatsStrengths of Chowdhury et al.See comments on Ann Intern Med website:http://annals.org.ezp-prod1.hul.harvard.edu/article.aspx?articleid=1846638 9.261

Slide6

Gross errors in data abstraction from original papersOmission of important studies, especially on polyunsaturated fat

Omission of important bodies of evidence (e.g. feeding studies)

Lack of specific comparisons, and failure to acknowledge thisMisrepresentation of findings (especially long-chain N-3 fatty acids)Failure to acknowledge other summaries based on primary data that had different conclusionsProblems with Chowdhury et al.See comments on Ann Intern Med website:http://annals.org.ezp-prod1.hul.harvard.edu/article.aspx?articleid=1846638 9.259

Slide7

Types of Studies of CHD

Study Type

StrengthsLimitationsEcologicalLarge numbersConfoundingFeeding StudiesControl of diet and confoundingSurrogate outcomesCohort StudiesClinical outcomes, better control of confoundingPotential remaining confoundingRandomized TrialsControl of confoundingAdherence to diet, costly9.258

Slide8

10-Year Coronary Incidence Per 10,000 Men

Keys, 1980

Incidence

Dalmatia

Velika Krsna

Zrenjanin

Belgrade

Rome railroad

Montegiorgio

Crevalcore

Corfu

Crete

Slavonia

Zutphen

west Finland

east Finland

Ushibuka

Tanushimaru

y=77+78x

P=0.73

9.006

(Keys 1980)

Slide9

Ten-year incidence rate of coronary heart disease, by any diagnostic criterion, plotted against the percentage of dietary calories supplied by total fats.

(Keys, 1980)

X = % DIET CALORIES FROM TOTAL FATSY = 10-YEAR CORONARY INCIDENCE PER 10,000 MENY= 64+27Xr = 0.39

E

W

N

K

Z

B

G

S

D

R

C

M

J

T

V

1000

2000

3000

0

10

20

30

40

0

Belgrade, Yugoslavia 3

Yugoslavia 2

Japan 1

east Finland

Crete

Holland

Italy 2

Yugoslavia 4

Yugoslavia 1

Slavonia

Italy 3

Japan 2

West Finland

Italy 1

Corfu

9.005

Slide10

Keys

Serum chol = 1.35 (2 S - P) + 1.5 C

0.5Hegsted Serum chol = 2.16 S – 1.65 P + 0.176 C

9.008

Slide11

Age-adjusted Death Rates for Coronary Heart Disease, US 1950-2007

Source: NHLBI website, Feb 2012

9.219

Deaths 100,000 Population

1,137,000 Deaths Averted in 2007 Due to Decline from Peak Rate in 1968 (1,543,000-406,000)

Year

Slide12

9.151

Slide13

Estimated Sources of Calories in US Diet

29.340

Sat fat

Mono fat

Poly fat

Trans fat

Protein

Other carbs

Potatoes

Whole grain

Refined grain

Added sugar

(unpublished, compiled from NHANES)

Slide14

Saturated Fat

Trans Fat

Refined Starch, Sugar Whole Grains

U

nsaturated Vegetable Fats

--

High monounsaturated

vegetable fats

--High polyunsaturated vegetable fats

Carbohydrates

29.536