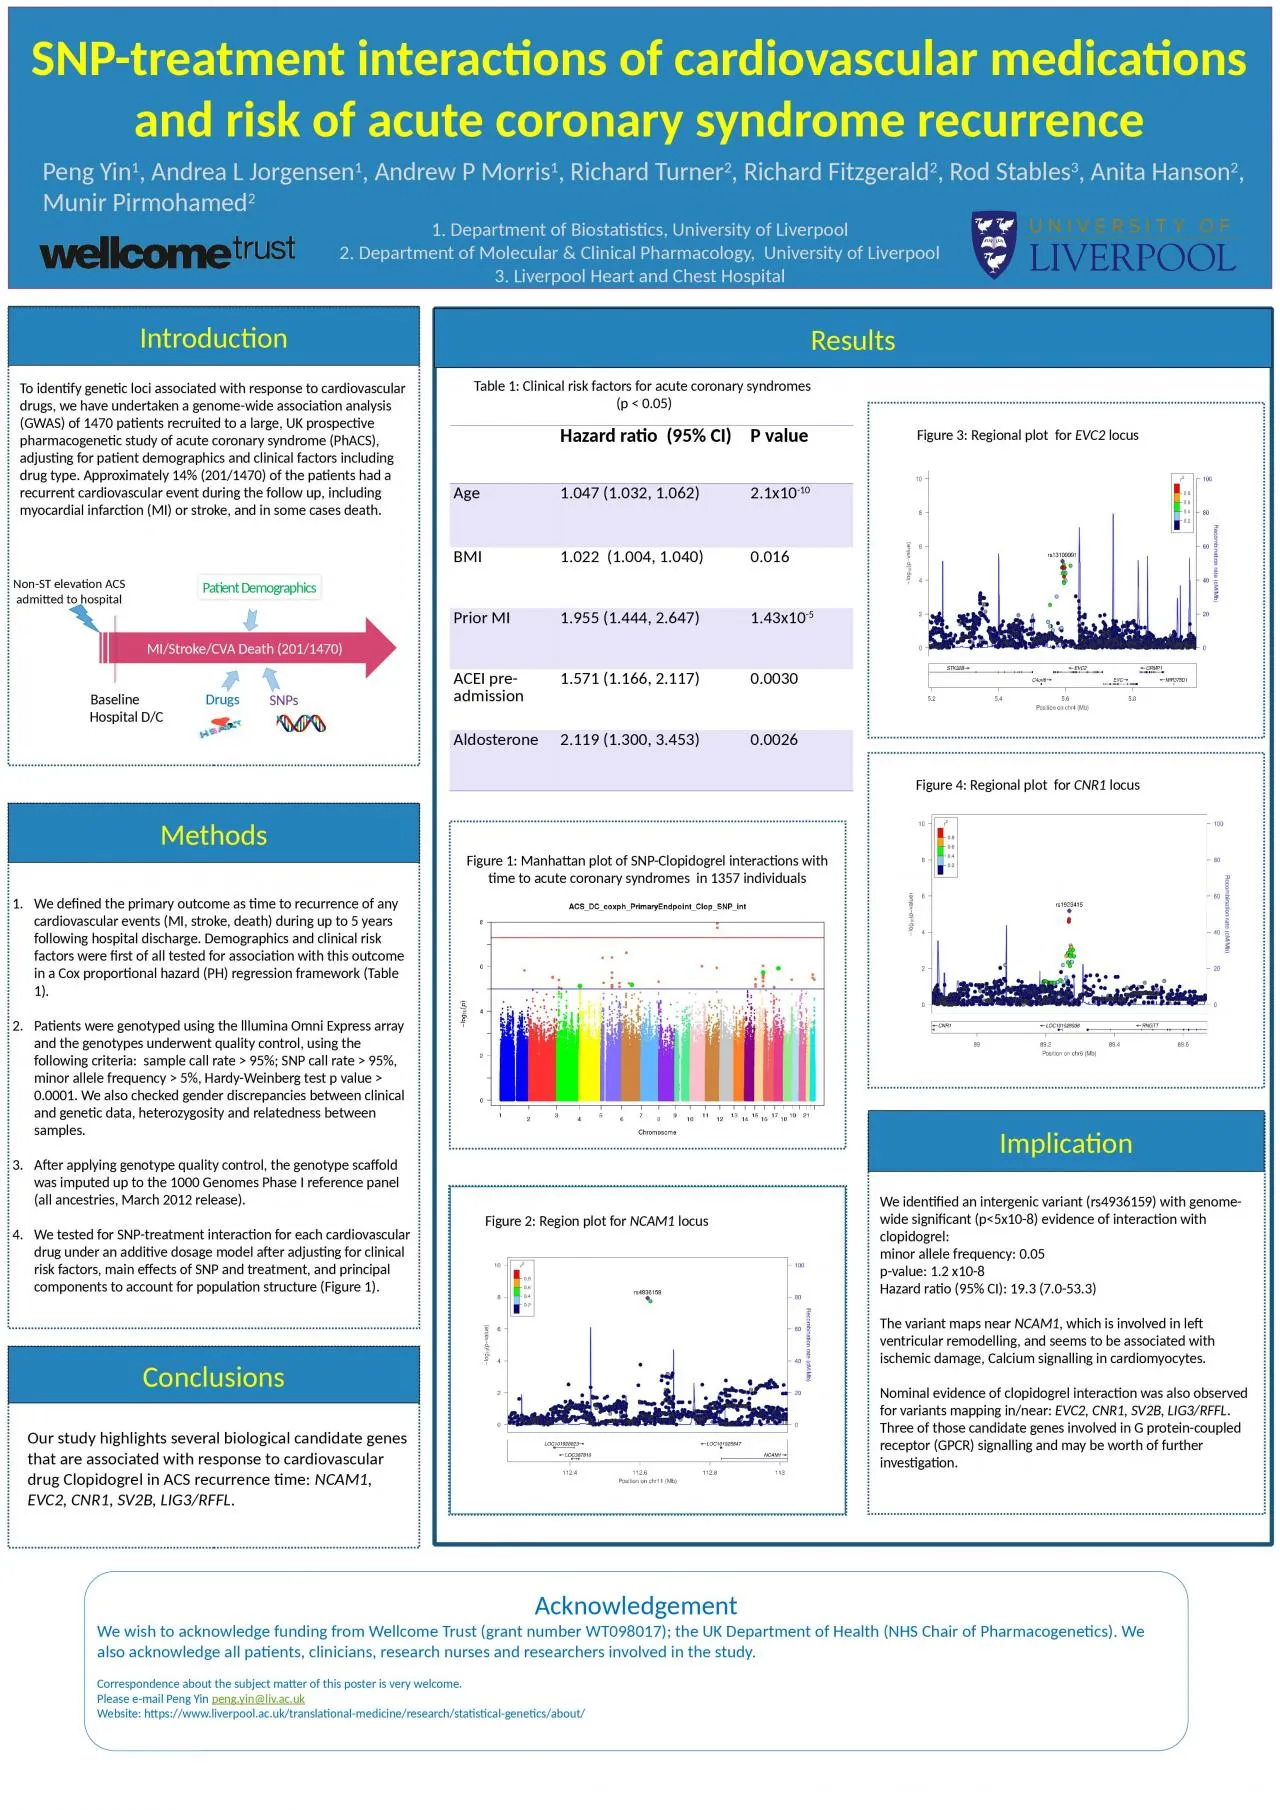
/
Peng  Yin 1 , Andrea  L Jorgensen Peng  Yin 1 , Andrea  L Jorgensen

Peng Yin 1 , Andrea L Jorgensen - PowerPoint Presentation

ani
ani . @ani
Follow
342 views
Uploaded On 2022-05-14

Peng Yin 1 , Andrea L Jorgensen - PPT Presentation

1 Andrew P Morris 1 Richard Turner 2 Richard Fitzgerald 2 Rod Stables 3 Anita Hanson 2 Munir Pirmohamed 2 1 Department of Biostatistics University of Liverpool 2 Department ID: 911108

clinical cardiovascular figure snp cardiovascular clinical snp figure risk clopidogrel plot patients factors coronary hospital acute demographics death evc2

Share:

Link:

Embed:

Download Presentation from below link

Download Presentation The PPT/PDF document "Peng Yin 1 , Andrea L Jorgensen" is the property of its rightful owner. Permission is granted to download and print the materials on this web site for personal, non-commercial use only, and to display it on your personal computer provided you do not modify the materials and that you retain all copyright notices contained in the materials. By downloading content from our website, you accept the terms of this agreement.


Presentation Transcript

Slide1

Peng

Yin

1

, Andrea L Jorgensen1, Andrew P Morris1, Richard Turner2, Richard Fitzgerald2, Rod Stables3, Anita Hanson2, Munir Pirmohamed21. Department of Biostatistics, University of Liverpool2. Department of Molecular & Clinical Pharmacology, University of Liverpool3. Liverpool Heart and Chest Hospital

We defined the primary outcome as time to recurrence of any cardiovascular events (MI, stroke, death) during up to 5 years following hospital

discharge. Demographics and clinical risk factors were first of all tested for association with this outcome in a Cox proportional hazard (PH) regression framework (Table 1).Patients were genotyped using the lllumina Omni Express array and the genotypes underwent quality control, using the following criteria: sample call rate > 95%; SNP call rate > 95%, minor allele frequency > 5%, Hardy-Weinberg test p value > 0.0001. We also checked gender discrepancies between clinical and genetic data, heterozygosity and relatedness between samples. After applying genotype quality control, the genotype scaffold was imputed up to the 1000 Genomes Phase I reference panel (all ancestries, March 2012 release). We tested for SNP-treatment interaction for each cardiovascular drug under an additive dosage model after adjusting for clinical risk factors, main effects of SNP and treatment, and principal components to account for population structure (Figure 1).

We identified an intergenic variant (rs4936159) with genome-wide significant (p<5x10⁻⁸) evidence of interaction with clopidogrel: minor allele frequency: 0.05p-value: 1.2 x10⁻⁸Hazard ratio (95% CI): 19.3 (7.0-53.3)The variant maps near NCAM1, which is involved in left ventricular remodelling, and seems to be associated with ischemic damage, Calcium signalling in cardiomyocytes.Nominal evidence of clopidogrel interaction was also observed for variants mapping in/near: EVC2, CNR1, SV2B, LIG3/RFFL. Three of those candidate genes involved in G protein-coupled receptor (GPCR) signalling and may be worth of further investigation.

Implication

Our study highlights several biological candidate genes that are associated with response to cardiovascular

drug Clopidogrel in ACS recurrence time: NCAM1, EVC2, CNR1, SV2B, LIG3/RFFL.

SNP-treatment interactions of cardiovascular medications and risk of acute coronary syndrome recurrence

To identify genetic loci associated with response to cardiovascular drugs, we have undertaken a genome-wide association analysis (GWAS) of 1470 patients recruited to a large, UK prospective pharmacogenetic study of acute coronary syndrome (PhACS), adjusting for patient demographics and clinical factors including drug type. Approximately 14% (201/1470) of the patients had a recurrent cardiovascular event during the follow up, including myocardial infarction (MI) or stroke, and in some cases death.

Non-ST elevation ACS admitted to hospital

Patient Demographics

Drugs

SNPs

MI/Stroke/CVA Death

(201/1470)

Introduction

Methods

Conclusions

Results

Acknowledgement

We wish to acknowledge funding from Wellcome Trust (grant number WT098017

); the

UK Department of Health (NHS Chair of Pharmacogenetics

). We also

acknowledge all patients, clinicians, research nurses and researchers involved in the study.

Correspondence about the subject matter of this poster is very welcome.

Please e-mail Peng Yin

peng.yin@liv.ac.ukWebsite: https://www.liverpool.ac.uk/translational-medicine/research/statistical-genetics/about/

Figure 1: Manhattan plot of SNP-Clopidogrel interactions with time to acute coronary syndromes in 1357 individuals

Figure 2: Region plot for NCAM1 locus

Figure 3: Regional plot for EVC2 locus

Table 1: Clinical risk factors for acute coronary syndromes

(p < 0.05)

Hazard ratio (95% CI)P valueAge1.047 (1.032, 1.062)2.1x10⁻¹⁰BMI1.022 (1.004, 1.040)0.016Prior MI1.955 (1.444, 2.647)1.43x10⁻⁵ACEI pre-admission1.571 (1.166, 2.117)0.0030Aldosterone 2.119 (1.300, 3.453)0.0026

Baseline

Hospital D/C

Figure

4: Regional plot

for

CNR1

locus