/
Supplemental Figure S1 Supplemental Supplemental Figure S1 Supplemental

Supplemental Figure S1 Supplemental - PowerPoint Presentation

aquaticle
aquaticle . @aquaticle
Follow
358 views
Uploaded On 2020-06-15

Supplemental Figure S1 Supplemental - PPT Presentation

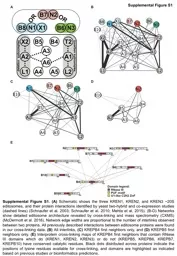
Figure S1 A Schematic shows the three KREN1 KREN2 and KREN3 20S editosomes and their protein interactions identified by yeast twohybrid and coexpression studies dashed lines Schnaufer et al 2003 Schnaufer et al 2010 Mehta et al 2015 BD Networks show detailed editosome a ID: 777511

cells krepb4 mutant figure krepb4 cells figure mutant supplemental proteins tet cross linking regulatable allele edited data tagged neighbors

Share:

Link:

Embed:

Download Presentation from below link

Download The PPT/PDF document "Supplemental Figure S1 Supplemental" is the property of its rightful owner. Permission is granted to download and print the materials on this web site for personal, non-commercial use only, and to display it on your personal computer provided you do not modify the materials and that you retain all copyright notices contained in the materials. By downloading content from our website, you accept the terms of this agreement.


Presentation Transcript

Slide1

Supplemental Figure S1

Supplemental

Figure

S1

.

(A)

Schematic shows the three KREN1, KREN2, and KREN3 ~20S editosomes, and their protein interactions identified by yeast two-hybrid and co-expression studies (dashed lines) (Schnaufer et al. 2003; Schnaufer et al. 2010; Mehta et al. 2015). (B-D) Networks show detailed editosome architecture revealed by cross-linking and mass spectrometry (CXMS) (McDermott et al. 2016). Network edge widths are proportional to the number of interlinks observed between two proteins. All previously described interactions between editosome proteins were found in our cross-linking data.

(B)

All interlinks,

(C)

KREPB4 first neighbors only, and

(D)

KREPB5 first neighbors only.

(E)

Interprotein cross-linking maps of KREPB4 first neighbors that contain RNase III domains which do (KREN1, KREN2, KREN3) or do not (KREPB5, KREPB6, KREPB7, KREPB10) have conserved catalytic residues

.

Black dots distributed across proteins indicate the positions of lysine

residues available for cross-linking, and domains

are highlighted as indicated based on previous studies or bioinformatics predictions. 

Slide2

Supplemental Figure S2

Supplemental Figure

S2.

(A)

Western analysis with anti-V5 tag monoclonal antibody showing expression of V5-tagged mutant KREPB4 proteins from the β-tubulin locus in BF and PF CN cells (equivalent of 4 x 10⁶ and 2 x 10⁶ cells/lane respectively) in the presence and absence of tet. (B) RT-qPCR analysis of BF and PF CN cells that constitutively express WT, or a PUF-triple (T280A/H281A/E284A) mutant version of KREPB4, and in which the tet-regulatable WT KREPB4 allele was expressed (E) or repressed (R) for 2 and 4 days respectively. The abundances of transcripts from KREPB4 alleles (B4 reg=tet-regulatable WT allele; B4 EE=exclusively expressed V5-tagged WT or mutant allele; B4 ORF=B4 open reading frame), and never-edited (COI and ND4), pre-edited, and edited mitochondrial mRNAs in repressed cells were calculated relative to cells expressing tet-regulatable WT KREPB4. For each target amplicon, relative abundance was determined using TERT as an internal control. Heat map shows the log10-transformed relative abundances of RNAs from BF cells (left) and PF cells (right), as indicated by the scale bar (bottom). Data represent mean of two experiments. (C) Data from (B), presented as means ± SEM, plotted on a log10 scale.

Slide3

Supplemental Figure S3

Supplemental Figure

S3.

Analysis of the growth of KREPB4 CN cells containing WT or putative PTM mutant versions of KREPB4.

Cumulative growth of BF and PF CN cells constitutively expressing V5-tagged WT or PTM mutant versions of KREPB4, and in which the tet-regulatable WT KREPB4 allele was expressed (E) or repressed (R). Exclusive expression of WT and all PTM mutant proteins (each indicated by R) permitted normal growth in BF and PF.