PPT-Supplemental figure 1 PD-L2 (
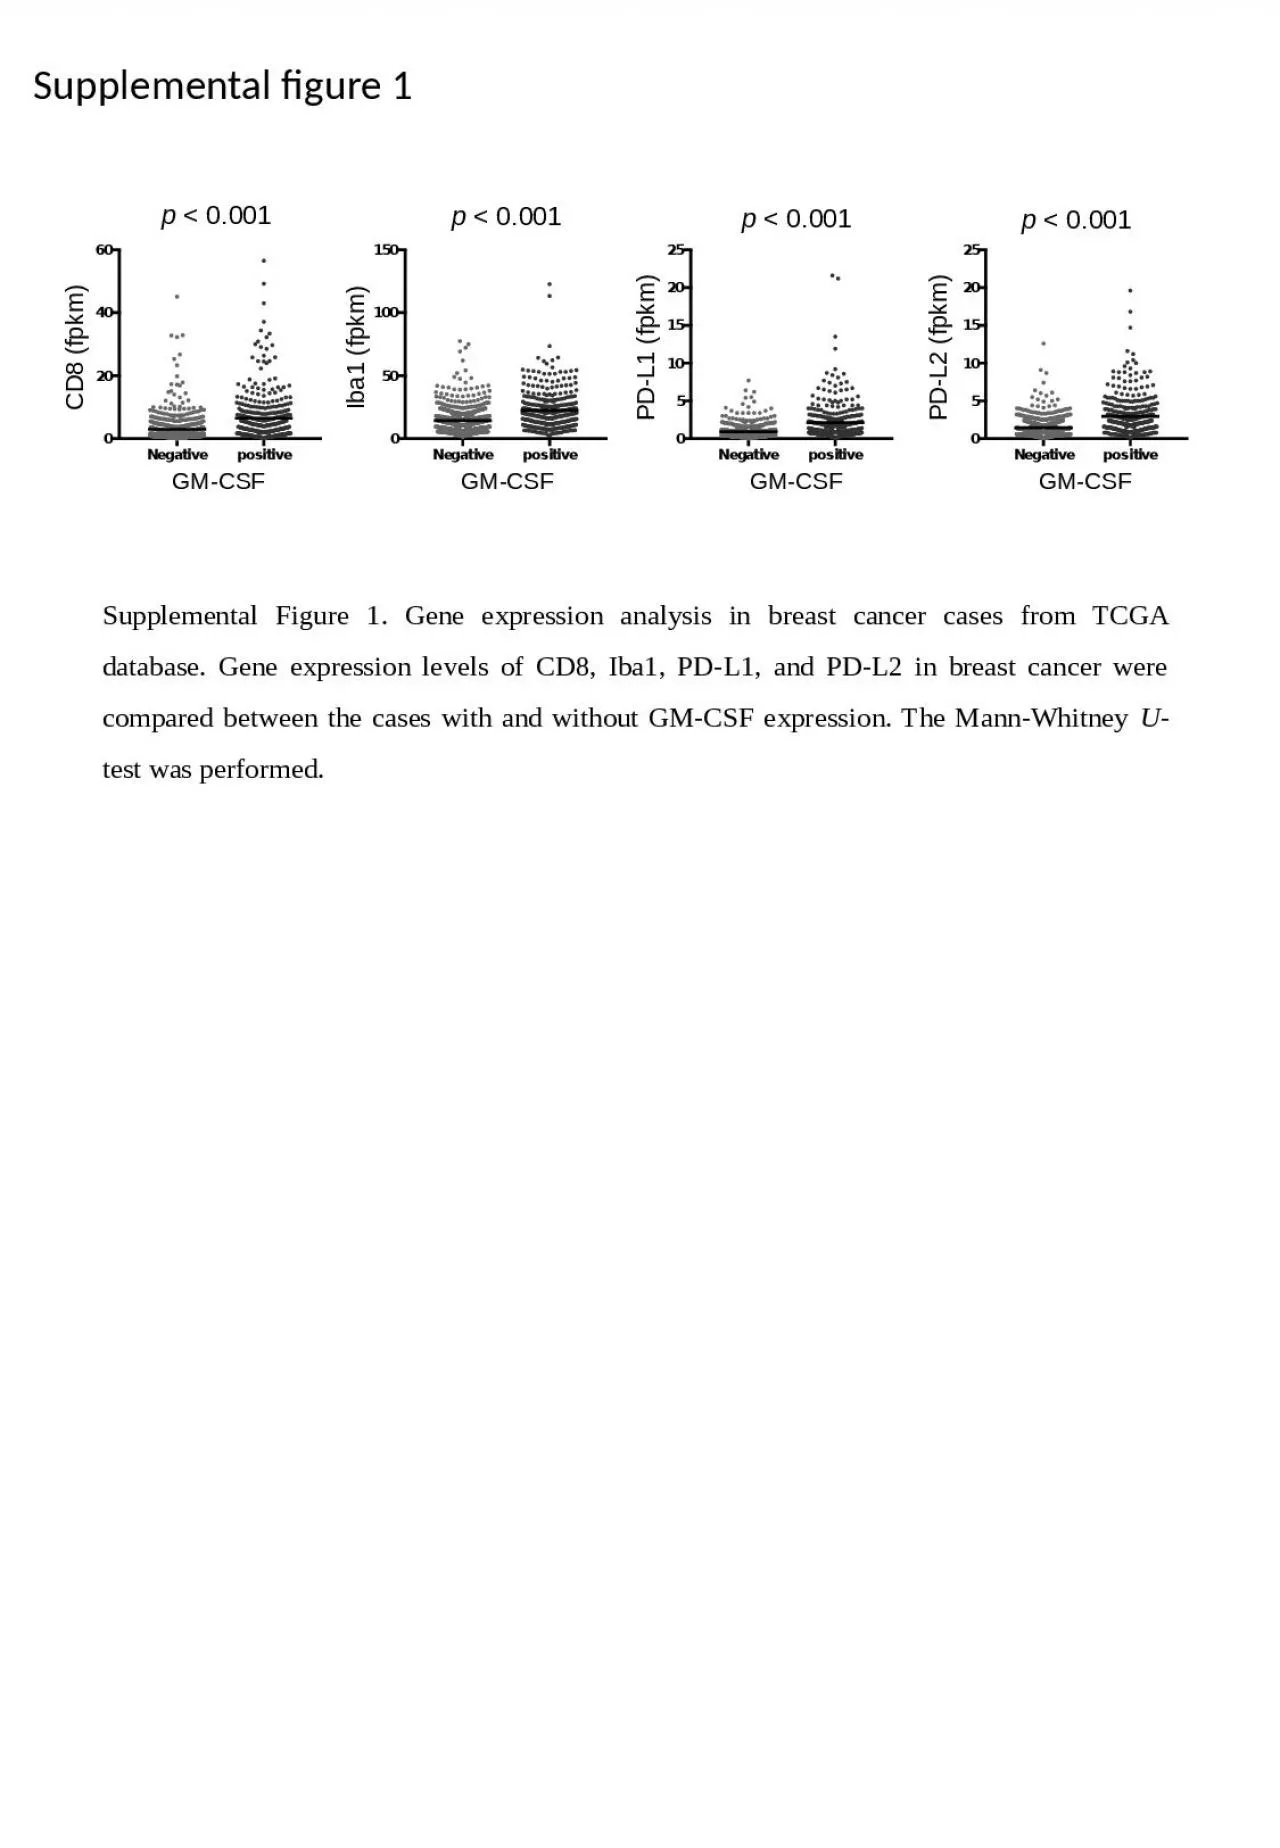
fpkm PDL1 fpkm CD8 fpkm Iba1 fpkm p lt 0001 p lt 0001 p lt 0001 p lt 0001 GMCSF GMCSF GMCSF GMCSF Supplemental Figure 1 Gene expression analysis in breast cancer
Download Presentation
"Supplemental figure 1 PD-L2 (" is the property of its rightful owner. Permission is granted to download and print materials on this website for personal, non-commercial use only, provided you retain all copyright notices. By downloading content from our website, you accept the terms of this agreement. Download
Presentation Transcript
Transcript not available.