PPT-Supplemental Figure 1A: Association between 19
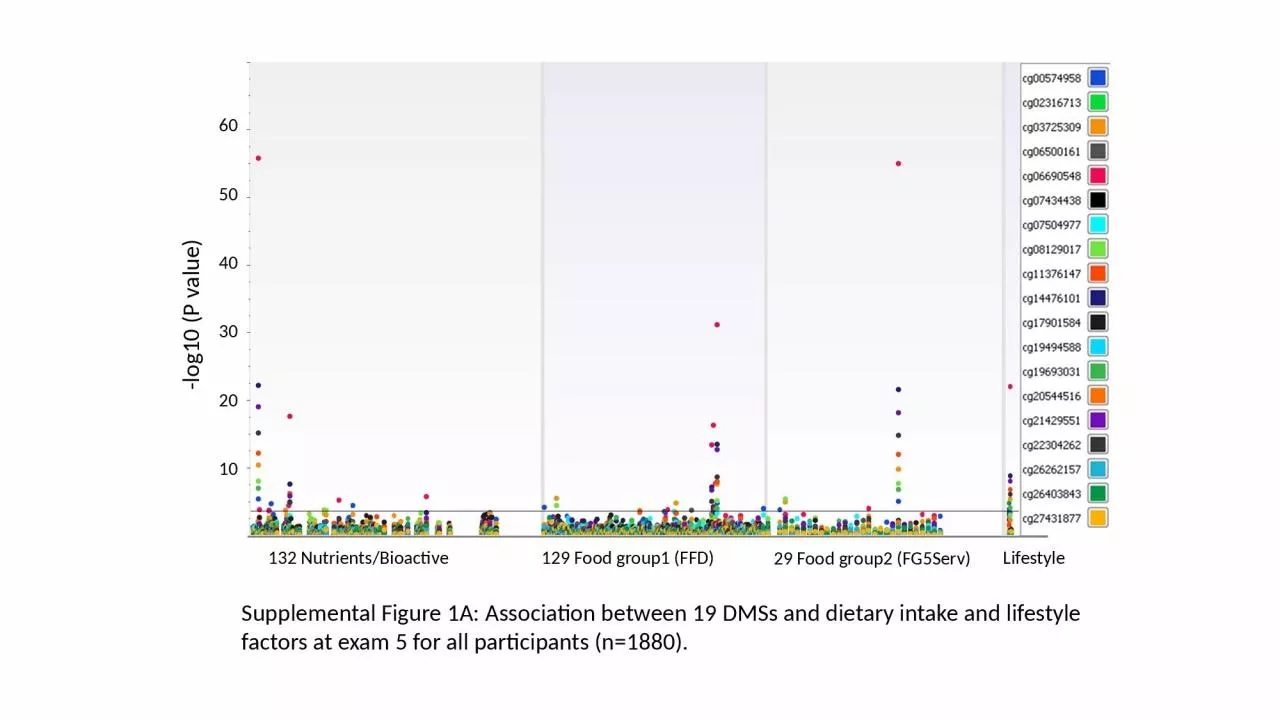
DMSs and dietary intake and lifestyle factors at exam 5 for all participants n1880 log10 P value 60 50 40 30 20 10 132 NutrientsBioactive 129 Food group1 FFD 29
Download Presentation
"Supplemental Figure 1A: Association between 19" is the property of its rightful owner. Permission is granted to download and print materials on this website for personal, non-commercial use only, provided you retain all copyright notices. By downloading content from our website, you accept the terms of this agreement.
Presentation Transcript
Transcript not available.