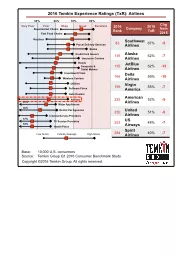
TxR Airlines Copyright 2016 Temkin Group All rights reserved Base 10000 US consumers Source Temkin Group Q1 2016 Consumer Benchmark Study 2016 Rank Company 2016 TxR Chg from 2015 ID: 800724
Download The PPT/PDF document "2016 Temkin Experience Ratings (" is the property of its rightful owner. Permission is granted to download and print the materials on this web site for personal, non-commercial use only, and to display it on your personal computer provided you do not modify the materials and that you retain all copyright notices contained in the materials. By downloading content from our website, you accept the terms of this agreement.
Slide1
2016 Temkin Experience Ratings (TxR): Airlines
Copyright
©2016
Temkin Group. All rights reserved.
Base:
10,000 U.S. consumersSource: Temkin Group Q1 2016 Consumer Benchmark Study
2016RankCompany2016 TxR Chg from 201583Southwest Airlines67%-5135Alaska Airlines62%-7135JetBlue Airlines62%-13166Delta Airlines59%-10199Virgin America55%-7225American Airlines52%-5230United Airlines51%-5253US Airways48%-7284Spirit Airlines40%-7
Slide22016 Temkin Experience Ratings Components: Airlines
Ratings Compared with Industry Average
Copyright
©2016
Temkin Group. All rights reserved.
Base:
10,000 U.S. consumersSource: Temkin Group Q1 2016 Consumer Benchmark StudyVirgin AmericaAmerican AirlinesUnited AirlinesUS AirwaysSpirit Airlines
Slide32011 to 2016 Temkin Experience Ratings: Airlines
Copyright
©2016
Temkin Group. All rights reserved.
Base:
10,000 U.S. consumersSource: Temkin Group Q1 2016 Consumer Benchmark Study
Overall Temkin Experience RatingsTemkin Experience Ratings Components
Slide42016 Temkin Experience Ratings (TxR): Major Appliances
Copyright
©2016
Temkin Group. All rights reserved.
Base:
10,000 U.S. consumersSource: Temkin Group Q1 2016 Consumer Benchmark Study
2016RankCompany2016 TxR Chg from 2015153Whirlpool60%-4166Samsung59%-6182LG57%-5190Bosch56%-1199GE55%N/A217Electrolux53%-11253Toshiba48%-3270Haier46%-13274Hitachi45%-2294Fujitsu29%-16
Slide52016 Temkin Experience Ratings Components: Major Appliances
Ratings Compared with Industry Average
Copyright
©2016
Temkin Group. All rights reserved.
Base:
10,000 U.S. consumersSource: Temkin Group Q1 2016 Consumer Benchmark StudyGEElectroluxToshibaHaierHitachiFujitsu
Slide62012 to 2016 Temkin Experience Ratings: Major Appliances
Copyright
©2016
Temkin Group. All rights reserved.
Base:
10,000 U.S. consumersSource: Temkin Group Q1 2016 Consumer Benchmark Study
Overall Temkin Experience RatingsTemkin Experience Ratings Components
Slide72016 Temkin Experience Ratings (TxR): Auto Dealer
Copyright
©2016
Temkin Group. All rights reserved.
Base:
10,000 U.S. consumersSource: Temkin Group Q1 2016 Consumer Benchmark Study
2016RankCompany2016 TxR Chg from 201589Toyota66%-5100Mercedes-Benz65%+2125Lexus63%-10135Chevrolet62%-2142Kia61%+1142Hyundai61%-1153Honda60%-9166Ford59%-6175Buick58%-4190Dodge56%-7190Nissan56%-11
217
Audi
53%
+1
217
Mazda
53%
-10
225
Jeep
52%
-4
230
BMW
51%
-15
230
Subaru
51%
-6
248
Cadillac
49%
-12
264
GM
47%
-13
274
Chrysler
45%
-9
278
Volkswagen
44%
-17
Slide82016 Temkin Experience Ratings Components: Auto Dealer
Ratings Compared with Industry Average
Copyright
©2016
Temkin Group. All rights reserved.
Base:
10,000 U.S. consumersSource: Temkin Group Q1 2016 Consumer Benchmark StudyBuickNissanDodgeMazdaAudiJeepSubaruBMWCadillacGMChryslerVolkswagen
Slide92012 to 2016 Temkin Experience Ratings: Auto Dealer
Copyright
©2016
Temkin Group. All rights reserved.
Base:
10,000 U.S. consumersSource: Temkin Group Q1 2016 Consumer Benchmark Study
Overall Temkin Experience RatingsTemkin Experience Ratings Components
Slide102016 Temkin Experience Ratings (TxR): Banks
Copyright
©2016
Temkin Group. All rights reserved.
Base:
10,000 U.S. consumersSource: Temkin Group Q1 2016 Consumer Benchmark Study
2016RankCompany2016 TxR Chg from 20157A credit union77%-512USAA75%-712Regions75%-342Capital One 36071%0
51
TD Bank
70%
-2
51
PNC
70%
-3
69
SunTrust Bank
68%
-5
69
U.S. Bank
68%
-4
83
Chase
67%
-6
89
Capital One
66%
0
100
Fifth Third
65%
-1
110
Wells Fargo
64%
-2
125
Bank of America
63%
-4
153
Citizens
60%
-12
190
Citibank
56%
-6
Slide112016 Temkin Experience Ratings Components: Banks
Ratings Compared with Industry Average
Copyright
©2016
Temkin Group. All rights reserved.
Base:
10,000 U.S. consumersSource: Temkin Group Q1 2016 Consumer Benchmark StudySunTrust BankChaseCapital OneFifth ThirdWells FargoBank of AmericaCitizensCitibankTD Bank
Slide122011 to 2016 Temkin Experience Ratings: Banks
Copyright
©2016
Temkin Group. All rights reserved.
Base:
10,000 U.S. consumersSource: Temkin Group Q1 2016 Consumer Benchmark Study
Overall Temkin Experience RatingsTemkin Experience Ratings Components
Slide132016 Temkin Experience Ratings (TxR): Rental Car Agencies
Copyright
©2016
Temkin Group. All rights reserved.
Base:
10,000 U.S. consumersSource: Temkin Group Q1 2016 Consumer Benchmark Study
2016RankCompany2016 TxR Chg from 2015142National Car Rental61%-5142Enterprise Rent-A-Car61%-6166Alamo Rent A Car59%-9217Hertz53%-9230Avis51%-7241ACE Rent A Car50%-12241Budget50%-8248Fox Rent A Car49%+7248Advantage Rent-A-Car49%-6274Thrifty45%-5292Dollar
36%
-11
Slide142016 Temkin Experience Ratings Components: Rental Car Agencies
Ratings Compared with Industry Average
Copyright
©2016
Temkin Group. All rights reserved.
Base:
10,000 U.S. consumersSource: Temkin Group Q1 2016 Consumer Benchmark StudyAvisBudgetACE Rent A CarAdvantage Rent-A-CarFox Rent A CarThriftyDollar
Slide152012 to 2016 Temkin Experience Ratings: Rental Car Agencies
Copyright
©2016
Temkin Group. All rights reserved.
Base:
10,000 U.S. consumersSource: Temkin Group Q1 2016 Consumer Benchmark Study
Overall Temkin Experience RatingsTemkin Experience Ratings Components
Slide162016 Temkin Experience Ratings (TxR): Computer & Tablet Makers
Copyright
©2016
Temkin Group. All rights reserved.
Base:
10,000 U.S. consumersSource: Temkin Group Q1 2016 Consumer Benchmark Study
2016RankCompany2016 TxR Chg from 201528Amazon73%-2142Barnes & Noble61%+1142Hewlett-Packard61%-2153Apple60%-8182Gateway57%N/A199Toshiba55%-5199Dell55%-2199Lenovo55%0217Acer53%-4241Sony50%-10278Compaq44%N/A
278
eMachines
44%
N/A
Slide172016 Temkin Experience Ratings Components: Computer & Tablet Makers
Ratings Compared with Industry Average
Copyright
©2016
Temkin Group. All rights reserved.
Base:
10,000 U.S. consumersSource: Temkin Group Q1 2016 Consumer Benchmark StudyLenovoDellToshibaAcerSonyeMachinesCompaq
Slide182011 to 2016 Temkin Experience Ratings: Computer & Tablet Makers
Copyright
©2016
Temkin Group. All rights reserved.
Base:
10,000 U.S. consumersSource: Temkin Group Q1 2016 Consumer Benchmark Study
Overall Temkin Experience RatingsTemkin Experience Ratings Components
Slide192016 Temkin Experience Ratings (TxR): Credit Card Issuers
Copyright
©2016
Temkin Group. All rights reserved.
Base:
10,000 U.S. consumersSource: Temkin Group Q1 2016 Consumer Benchmark Study
2016RankCompany2016 TxR Chg from 201560USAA69%-1169Discover68%-589Chase66%-289Barclaycard66%-2100Capital One65%0110American Express64%-9142Citigroup61%-5175Wells Fargo58%-3175U.S. Bank58%-8182Bank of America57%-6274HSBC
45%
-9
Slide202016 Temkin Experience Ratings Components: Credit Card Issuers
Ratings Compared with Industry Average
Copyright
©2016
Temkin Group. All rights reserved.
Base:
10,000 U.S. consumersSource: Temkin Group Q1 2016 Consumer Benchmark StudyCitigroupU.S. BankWells FargoBank of AmericaHSBC
Slide212011 to 2016 Temkin Experience Ratings: Credit Card Issuers
Copyright
©2016
Temkin Group. All rights reserved.
Base:
10,000 U.S. consumersSource: Temkin Group Q1 2016 Consumer Benchmark Study
Overall Temkin Experience RatingsTemkin Experience Ratings Components
Slide222016 Temkin Experience Ratings (TxR): Fast Food Chains
Copyright
©2016
Temkin Group. All rights reserved.
Base:
10,000 U.S. consumersSource: Temkin Group Q1 2016 Consumer Benchmark Study
2016RankCompany2016 TxR Chg from 20153Chick-fil-A78%-412Subway75%-420IHOP74%N/A20Little Caesar’s74%-128Arby’s73%-328Taco Bell73%-528Hardees73%+128Dunkin’ Donuts73%-536Pizza Hut72%-636Dairy Queen72%-942Starbucks71%-7
42
Wendy’s
71%
-6
51
Jack in the Box
70%
+2
51
Sonic Drive-In
70%
-10
60
Domino’s
69%
-5
69
KFC
68%
-6
89
Baskin Robbins
66%
N/A
100
Burger King
65%
-8
100
McDonalds
65%
-7
Slide232016 Temkin Experience Ratings Components: Fast Food Chains
Ratings Compared with Industry Average
Copyright
©2016
Temkin Group. All rights reserved.
Base:
10,000 U.S. consumersSource: Temkin Group Q1 2016 Consumer Benchmark StudyPizza HutWendy’sStarbucksSonic Drive-inJack in the BoxDomino’sKFCBaskin RobbinsMcDonaldsBurger King
Slide242012 to 2016 Temkin Experience Ratings: Fast Food Chains
Copyright
©2016
Temkin Group. All rights reserved.
Base:
10,000 U.S. consumersSource: Temkin Group Q1 2016 Consumer Benchmark Study
Overall Temkin Experience RatingsTemkin Experience Ratings Components
Slide252016 Temkin Experience Ratings (TxR): Health Plans
Copyright
©2016
Temkin Group. All rights reserved.
Base:
10,000 U.S. consumersSource: Temkin Group Q1 2016 Consumer Benchmark Study
2016RankCompany2016 TxR Chg from 2015182Kaiser Permanente57%-9199TriCare55%-12230Aetna51%-1241CIGNA50%-1241United Healthcare50%-9248Coventry Health Care49%+10253Medicare48%-11253Humana48%-15253BCBS plan not listed48%-5264Anthem47%-5284Medicaid40%
-11
284
Blue Shield of California
40%
-8
288
Empire
38%
N/A
289
Highmark
37%
N/A
289
CareFirst
37%
N/A
293
Health Net
32%
-14
Slide262016 Temkin Experience Ratings Components: Health Plans
Ratings Compared with Industry Average
Copyright
©2016
Temkin Group. All rights reserved.
Base:
10,000 U.S. consumersSource: Temkin Group Q1 2016 Consumer Benchmark StudyHumanaMedicareAnthemBlue Shield of CaliforniaMedicaidEmpireCareFirstHighmarkHeath Net
Slide272011 to 2016 Temkin Experience Ratings: Health Plans
Copyright
©2016
Temkin Group. All rights reserved.
Base:
10,000 U.S. consumersSource: Temkin Group Q1 2016 Consumer Benchmark Study
Overall Temkin Experience RatingsTemkin Experience Ratings Components
Slide282016 Temkin Experience Ratings (TxR): Hotels
Copyright
©2016
Temkin Group. All rights reserved.
Base:
10,000 U.S. consumersSource: Temkin Group Q1 2016 Consumer Benchmark Study
2016RankCompany2016 TxR Chg from 201542Residence Inn71%+242Holiday Inn Express71%+360Hilton69%-469Marriott68%-889Wyndham66%N/A110Hampton Inn64%-9110La Quinta Inn64%-4110Sheraton64%-11142Courtyard By Marriott61%-13142Best Western61%-3153Comfort Inn60%-5
153
Hyatt
60%
-12
153
Quality Inn
60%
-3
166
Holiday Inn
59%
-8
199
Crowne Plaza
55%
-2
199
Radisson
55%
N/A
211
Westin
54%
-13
241
Super 8
50%
-10
253
Fairfield Inn
48%
-17
270
Days Inn
46%
-11
283
Motel 6
41%
-12
Slide292016 Temkin Experience Ratings Components: Hotels
Ratings Compared with Industry Average
Copyright
©2016
Temkin Group. All rights reserved.
Base:
10,000 U.S. consumersSource: Temkin Group Q1 2016 Consumer Benchmark StudyCourtyard By MarriottQuality InnHyattComfort InnHoliday InnRadissonCrowne PlazaWestinSuper 8Fairfield InnDays InnMotel 6
Slide302011 to 2016 Temkin Experience Ratings: Hotels
Copyright
©2016
Temkin Group. All rights reserved.
Base:
10,000 U.S. consumersSource: Temkin Group Q1 2016 Consumer Benchmark Study
Overall Temkin Experience RatingsTemkin Experience Ratings Components
Slide312016 Temkin Experience Ratings (TxR): Insurance Carriers
Copyright
©2016
Temkin Group. All rights reserved.
Base:
10,000 U.S. consumersSource: Temkin Group Q1 2016 Consumer Benchmark Study
2016RankCompany2016 TxR Chg from 201528USAA73%-269State Farm68%-369The Hartford68%0110Nationwide64%+1110GEICO64%-5110Progressive64%-3135Allstate62%-5142Travelers61%-1153Liberty Mutual60%-1153New York Life60%N/A175Farmers58%0
211
AAA
54%
-9
211
MetLife
54%
-3
264
American Family
47%
-14
264
21st Century
47%
-4
Slide322016 Temkin Experience Ratings Components: Insurance Carriers
Ratings Compared with Industry Average
Copyright
©2016
Temkin Group. All rights reserved.
Base:
10,000 U.S. consumersSource: Temkin Group Q1 2016 Consumer Benchmark Study
Slide332011 to 2016 Temkin Experience Ratings: Insurance Carriers
Copyright
©2016
Temkin Group. All rights reserved.
Base:
10,000 U.S. consumersSource: Temkin Group Q1 2016 Consumer Benchmark Study
Overall Temkin Experience RatingsTemkin Experience Ratings Components
Slide342016 Temkin Experience Ratings (TxR): Internet Service Providers
Copyright
©2016
Temkin Group. All rights reserved.
Base:
10,000 U.S. consumersSource: Temkin Group Q1 2016 Consumer Benchmark Study
2016RankCompany2016 TxR Chg from 2015199AOL55%-5225Cox Comm.52%-3230Verizon51%-6241AT&T50%-4253Time Warner Cable48%+1253Charter Comm.48%-6264Cablevision47%-9284Comcast40%-5
Slide352016 Temkin Experience Ratings Components: Internet Service Providers
Ratings Compared with Industry Average
Copyright
©2016
Temkin Group. All rights reserved.
Base:
10,000 U.S. consumersSource: Temkin Group Q1 2016 Consumer Benchmark StudyComcast
Slide362011 to 2016 Temkin Experience Ratings: Internet Service Providers
Copyright
©2016
Temkin Group. All rights reserved.
Base:
10,000 U.S. consumersSource: Temkin Group Q1 2016 Consumer Benchmark Study
Overall Temkin Experience RatingsTemkin Experience Ratings Components
Slide372016 Temkin Experience Ratings (TxR): Investment Firms
Copyright
©2016
Temkin Group. All rights reserved.
Base:
10,000 U.S. consumersSource: Temkin Group Q1 2016 Consumer Benchmark Study
2016RankCompany2016 TxR Chg from 2015110Edward Jones64%+1110Fidelity Investments64%-9125Morgan Stanley Smith Barney63%+2135Charles Schwab62%-7153Merrill Lynch60%-2153Vanguard60%-8182A credit union57%-7182Ameriprise Financial57%-8199TD Ameritrade55%-4211Scottrade54%-12230E*TRADE51%
-6
230
Wells Fargo Advisors
51%
-11
253
Capital One 360
48%
-7
Slide382016 Temkin Experience Ratings Components: Investment Firms
Ratings Compared with Industry Average
Copyright
©2016
Temkin Group. All rights reserved.
Base:
10,000 U.S. consumersSource: Temkin Group Q1 2016 Consumer Benchmark StudyA credit unionTD AmeritradeScottradeWells Fargo AdvisorsE*TRADECapital One 360
Slide392011 to 2016 Temkin Experience Ratings: Investment Firms
Copyright
©2016
Temkin Group. All rights reserved.
Base:
10,000 U.S. consumersSource: Temkin Group Q1 2016 Consumer Benchmark Study
Overall Temkin Experience RatingsTemkin Experience Ratings Components
Slide402016 Temkin Experience Ratings (TxR): Parcel Delivery Service
Copyright
©2016
Temkin Group. All rights reserved.
Base:
10,000 U.S. consumersSource: Temkin Group Q1 2016 Consumer Benchmark Study
2016RankCompany2016 TxR Chg from 201551UPS70%-469FedEx68%-589U.S. Postal Service66%-7190DHL56%-7
Slide412016 Temkin Experience Ratings Components: Parcel Delivery Service
Ratings Compared with Industry Average
Copyright
©2016
Temkin Group. All rights reserved.
Base:
10,000 U.S. consumersSource: Temkin Group Q1 2016 Consumer Benchmark StudyDHL
Slide422012 to 2016 Temkin Experience Ratings: Parcel Delivery Services
Copyright
©2016
Temkin Group. All rights reserved.
Base:
10,000 U.S. consumersSource: Temkin Group Q1 2016 Consumer Benchmark Study
Overall Temkin Experience RatingsTemkin Experience Ratings Components
Slide432016 Temkin Experience Ratings (TxR
): Retailers
Copyright
©2016
Temkin Group. All rights reserved.
Base: 10,000 U.S. consumersSource: Temkin Group
Q1 2016 Consumer Benchmark Study
Slide442016 Temkin Experience Ratings (TxR): Retailers
Copyright
©2016
Temkin Group. All rights reserved.
Base:
10,000 U.S. consumersSource: Temkin Group Q1 2016 Consumer Benchmark Study
2016RankCompany2016 TxR Chg from 20153True Value78%+89Amazon.com76%-59O'Reilly Auto Parts76%-212QVC75%-112Dollar Tree75%-220Sam's Club74%-220Dollar General74%-228Lowe's73%-636PetSmart72%-936Michael’s72%N/A36BJ’s Wholesale Club72%-5
42
JCPenney
71%
-4
42
Family Dollar
71%
-2
42
Ace Hardware
71%
-5
42
Kohl's
71%
-2
51
7-Eleven
70%
-1
51
Walgreens
70%
-10
51
Rite Aid
70%
-7
51
Target
70%
-4
60
eBay
69%
-5
60
CVS
69%
-8
60
Home Depot
69%
-8
69
Costco
68%
-11
2016
Rank
Company
2016
TxR
Chg from 2015
69
T.J. Maxx
68%
-6
69
AutoZone
68%
-8
69
Staples
68%
-7
69
Barnes & Noble
68%
-8
83
Nordstrom
67%
-7
83
Advance Auto Parts
67%
-11
89
Ross
66%
-4
100
Apple Retail Store
65%
-6
100
Bed Bath & Beyond
65%
-15
110
Sears
64%
0
110
Toys 'R' Us
64%
-7
110Best Buy64%-4110
Wal-Mart
64%
-6
110
Office Depot
64%
-10
125
GameStop
63%
-5
125
Marshalls
63%
-11
125
OfficeMax
63%
-11
135
Macy's
62%
-10
135
Kmart
62%
-7
153
Old Navy
60%
-12
166
Foot Locker
59%
-10
175
Gap
58%
-8
199
RadioShack
55%
-8
Slide452016 Temkin Experience Ratings Components: Retailers 1-23
Ratings Compared with Industry Average
Copyright
©2016
Temkin Group. All rights reserved.
Base:
10,000 U.S. consumersSource: Temkin Group Q1 2016 Consumer Benchmark StudyHome DepotCVSeBayBarnes & Noble
Slide462016 Temkin Experience Ratings Components: Retailers 24-46
Ratings Compared with Industry Average
Copyright
©2016
Temkin Group. All rights reserved.
Base:
10,000 U.S. consumersSource: Temkin Group Q1 2016 Consumer Benchmark StudyStaplesAutoZoneT.J. MaxxCostcoAdvance Auto PartsNordstromRossBed Bath & BeyondApple Retail StoreOffice DepotWal-MartBest BuyToys ‘R’ UsSearsOfficeMaxMarshallsGameStopKmartMacy’sOld NavyFoot LockerGapRadioShack
Slide472011 to 2016 Temkin Experience Ratings: Retailers
Copyright
©2016
Temkin Group. All rights reserved.
Base:
10,000 U.S. consumersSource: Temkin Group Q1 2016 Consumer Benchmark Study
Overall Temkin Experience RatingsTemkin Experience Ratings Components
Slide482016 Temkin Experience Ratings (TxR): Software Firms
Copyright
©2016
Temkin Group. All rights reserved.
Base:
10,000 U.S. consumersSource: Temkin Group Q1 2016 Consumer Benchmark Study
2016RankCompany2016 TxR Chg from 201589Google66%0100Symantec65%+2153Microsoft60%0166Apple59%-8217Adobe53%-2225Intuit52%-12230Sony51%-10230Activision51%-6230McAfee51%-7270Blackboard46%-2
Slide492016 Temkin Experience Ratings Components: Software Firms
Ratings Compared with Industry Average
Copyright
©2016
Temkin Group. All rights reserved.
Base:
10,000 U.S. consumersSource: Temkin Group Q1 2016 Consumer Benchmark StudyAdobeIntuitMcAfeeActivisionSonyBlackboard
Slide502013 to 2016 Temkin Experience Ratings: Software Firms
Copyright
©2016
Temkin Group. All rights reserved.
Base:
10,000 U.S. consumersSource: Temkin Group Q1 2016 Consumer Benchmark Study
Overall Temkin Experience RatingsTemkin Experience Ratings Components
Slide512016 Temkin Experience Ratings (TxR): Supermarket Chains
Copyright
©2016
Temkin Group. All rights reserved.
Base:
10,000 U.S. consumersSource: Temkin Group Q1 2016 Consumer Benchmark Study
2016RankCompany2016 TxR Chg from 20151Publix81%-42H-E-B79%-53Kroger78%03Save-a-Lot78%N/A7Wegmans77%+19Aldi76%-712Food Lion75%-312ShopRite75%-312Giant Eagle75%-120Wawa Food Markets74%N/A20Hy-Vee74%-6
20
Winn-Dixie
74%
N/A
20
Trader Joe’s
74%
-8
28
Hannaford
73%
-8
36
Piggly Wiggly
72%
N/A
60
Albertsons
69%
-9
60
Stop & Shop
69%
-7
60
Safeway
69%
-6
69
Whole Foods
68%
-10
125
Vons
63%
N/A
Slide522016 Temkin Experience Ratings Components: Supermarket Chains
Ratings Compared with Industry Average
Copyright
©2016
Temkin Group. All rights reserved.
Base:
10,000 U.S. consumersSource: Temkin Group Q1 2016 Consumer Benchmark StudyWawa Food MarketsHannafordPiggly WigglySafewayStop & ShopAlbertsonsWhole FoodsVons
Slide532012 to 2016 Temkin Experience Ratings: Supermarket Chains
Copyright
©2016
Temkin Group. All rights reserved.
Base:
10,000 U.S. consumersSource: Temkin Group Q1 2016 Consumer Benchmark Study
Overall Temkin Experience RatingsTemkin Experience Ratings Components
Slide542016 Temkin Experience Ratings (TxR): TV Service Providers
Copyright
©2016
Temkin Group. All rights reserved.
Base:
10,000 U.S. consumersSource: Temkin Group Q1 2016 Consumer Benchmark Study
2016RankCompany2016 TxR Chg from 2015182DirecTV57%-3190Dish Network56%+2199Cablevision Optimum55%-6217Cox Comm.53%+3248Bright House Networks49%-6253Charter Comm.48%0264Verizon47%-9270Time Warner Cable46%-2282AT&T43%-11289Comcast37%-6
Slide552016 Temkin Experience Ratings Components: TV Service Providers
Ratings Compared with Industry Average
Copyright
©2016
Temkin Group. All rights reserved.
Base:
10,000 U.S. consumersSource: Temkin Group Q1 2016 Consumer Benchmark StudyTime Warner CableAT&TComcast
Slide562011 to 2016 Temkin Experience Ratings: TV Service Providers
Copyright
©2016
Temkin Group. All rights reserved.
Base:
10,000 U.S. consumersSource: Temkin Group Q1 2016 Consumer Benchmark Study
Overall Temkin Experience RatingsTemkin Experience Ratings Components
Slide572016 Temkin Experience Ratings (TxR
): Utilities
Copyright
©2016
Temkin Group. All rights reserved.
Base: 10,000 U.S. consumersSource: Temkin Group
Q1 2016 Consumer Benchmark Study
Slide582016 Temkin Experience Ratings (TxR): Utilities
Copyright
©2016
Temkin Group. All rights reserved.
Base:
10,000 U.S. consumersSource: Temkin Group Q1 2016 Consumer Benchmark Study
2016RankCompany2016 TxR Chg from 2015175DTE Energy Electric Company58%-5182Con Edison of New York57%+10190Pacific Gas and Electric Company56%-4211PSE&G54%-9217CenterPoint Energy53%N/A225Ameren Illinois Company52%N/A253Commonwealth Edison48%-15278Columbia Natural Gas44%N/A2016Rank
Company
2016
TxR
Chg from 2015
83
Florida Power & Light
67%
-2
83
Southern California Gas Company
67%
-7
89
TXU Energy
66%
N/A
89
Dominion Virginia Power
66%
+2
100
Alabama Power Company
65%
N/A
100
Georgia Power
65%
-9
142
Consumers Energy Company
61%
+7
166
Southern California Edison
59%
-8
175
Duke Energy Progress
58%
-2
Slide592016 Temkin Experience Ratings Components: Utilities 1-9
Ratings Compared with Industry Average
Copyright
©2016
Temkin Group. All rights reserved.
Base:
10,000 U.S. consumersSource: Temkin Group Q1 2016 Consumer Benchmark Study
Slide602016 Temkin Experience Ratings Components: 10-17
Ratings Compared with Industry Average
Copyright
©2016
Temkin Group. All rights reserved.
Base:
10,000 U.S. consumersSource: Temkin Group Q1 2016 Consumer Benchmark StudyPSE&GCenterPoint EnergyAmeren Illinois CompanyCommonwealth EdisonColumbia Natural Gas
Slide612015 to 2016 Temkin Experience Ratings: Utilities
Copyright
©2016
Temkin Group. All rights reserved.
Base:
10,000 U.S. consumersSource: Temkin Group Q1 2016 Consumer Benchmark Study
Overall Temkin Experience RatingsTemkin Experience Ratings Components
Slide622016 Temkin Experience Ratings (TxR): Wireless Carriers
Copyright
©2016
Temkin Group. All rights reserved.
Base:
10,000 U.S. consumersSource: Temkin Group Q1 2016 Consumer Benchmark Study
2016RankCompany2016 TxR Chg from 2015125MetroPCS63%+3125Virgin Mobile63%-5125TracFone63%0166Verizon Wireless59%-3190T-Mobile56%-9190AT&T56%-3211Sprint54%-1
Slide632016 Temkin Experience Ratings Components: Wireless Carriers
Ratings Compared with Industry Average
Copyright
©2016
Temkin Group. All rights reserved.
Base:
10,000 U.S. consumersSource: Temkin Group Q1 2016 Consumer Benchmark StudySprint
Slide642011 to 2016 Temkin Experience Ratings: Wireless Carriers
Copyright
©2016
Temkin Group. All rights reserved.
Base:
10,000 U.S. consumersSource: Temkin Group Q1 2016 Consumer Benchmark Study
Overall Temkin Experience RatingsTemkin Experience Ratings Components