/
Application of Optical Disdrometer to Characterize Simulated Rainfall and Measure Drop Application of Optical Disdrometer to Characterize Simulated Rainfall and Measure Drop

Application of Optical Disdrometer to Characterize Simulated Rainfall and Measure Drop - PowerPoint Presentation

audrey
audrey . @audrey
Follow
66 views
Uploaded On 2023-10-26

Application of Optical Disdrometer to Characterize Simulated Rainfall and Measure Drop - PPT Presentation

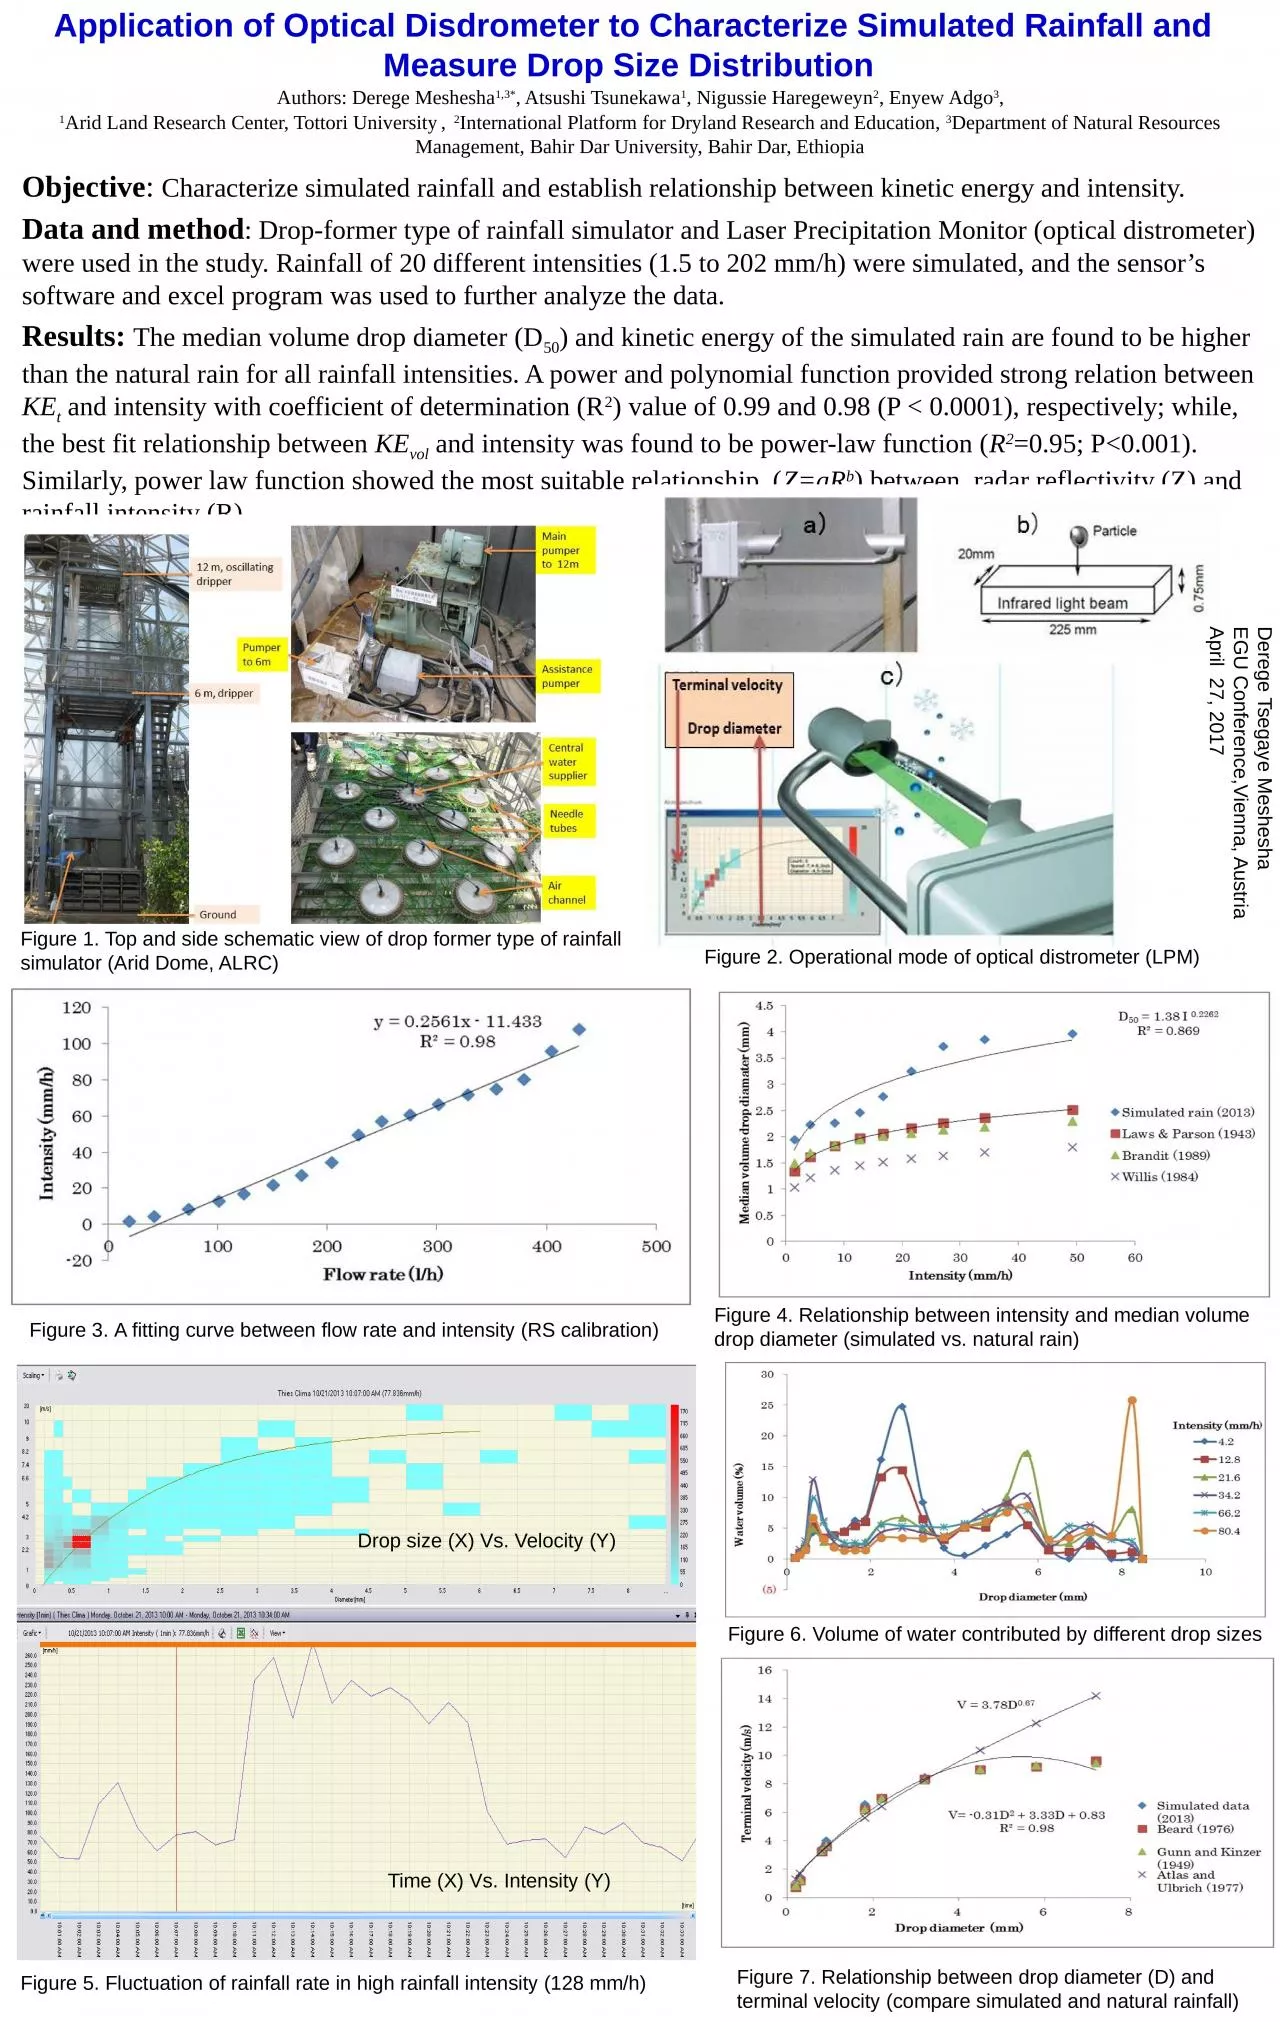
  Objective C haracterize simulated rainfall and establish relationship between kinetic energy and intensity Data and method Dropformer type of rainfall simulator and Laser Precipitation Monitor optical distrometer were used in the study Rainfall of 20 different intensities 15 to ID: 1024964

intensity rainfall figure drop rainfall intensity drop figure simulated relationship natural diameter optical volume rain power function velocity median

Share:

Link:

Embed:

Download Presentation from below link

Download Presentation The PPT/PDF document "Application of Optical Disdrometer to Ch..." is the property of its rightful owner. Permission is granted to download and print the materials on this web site for personal, non-commercial use only, and to display it on your personal computer provided you do not modify the materials and that you retain all copyright notices contained in the materials. By downloading content from our website, you accept the terms of this agreement.


Presentation Transcript

1. Application of Optical Disdrometer to Characterize Simulated Rainfall and Measure Drop Size Distribution  Objective: Characterize simulated rainfall and establish relationship between kinetic energy and intensity.Data and method: Drop-former type of rainfall simulator and Laser Precipitation Monitor (optical distrometer) were used in the study. Rainfall of 20 different intensities (1.5 to 202 mm/h) were simulated, and the sensor’s software and excel program was used to further analyze the data. Results: The median volume drop diameter (D50) and kinetic energy of the simulated rain are found to be higher than the natural rain for all rainfall intensities. A power and polynomial function provided strong relation between KEt and intensity with coefficient of determination (R2) value of 0.99 and 0.98 (P < 0.0001), respectively; while, the best fit relationship between KEvol and intensity was found to be power-law function (R2=0.95; P<0.001). Similarly, power law function showed the most suitable relationship (Z=aRb) between radar reflectivity (Z) and rainfall intensity (R).Figure 1. Top and side schematic view of drop former type of rainfall simulator (Arid Dome, ALRC)Figure 2. Operational mode of optical distrometer (LPM)Figure 3. A fitting curve between flow rate and intensity (RS calibration)Figure 4. Relationship between intensity and median volume drop diameter (simulated vs. natural rain)Figure 5. Fluctuation of rainfall rate in high rainfall intensity (128 mm/h)Figure 7. Relationship between drop diameter (D) and terminal velocity (compare simulated and natural rainfall) Derege Tsegaye MesheshaEGU Conference,Vienna, Austria April 27, 2017Drop size (X) Vs. Velocity (Y)Time (X) Vs. Intensity (Y) Authors: Derege Meshesha1,3*, Atsushi Tsunekawa1, Nigussie Haregeweyn2, Enyew Adgo3, 1Arid Land Research Center, Tottori University , 2International Platform for Dryland Research and Education, 3Department of Natural Resources Management, Bahir Dar University, Bahir Dar, EthiopiaFigure 6. Volume of water contributed by different drop sizes