PDF-HEDI Charts for Local Measure5 TeachersLocal Measures of Student Ach
Author : audrey | Published Date : 2021-06-17
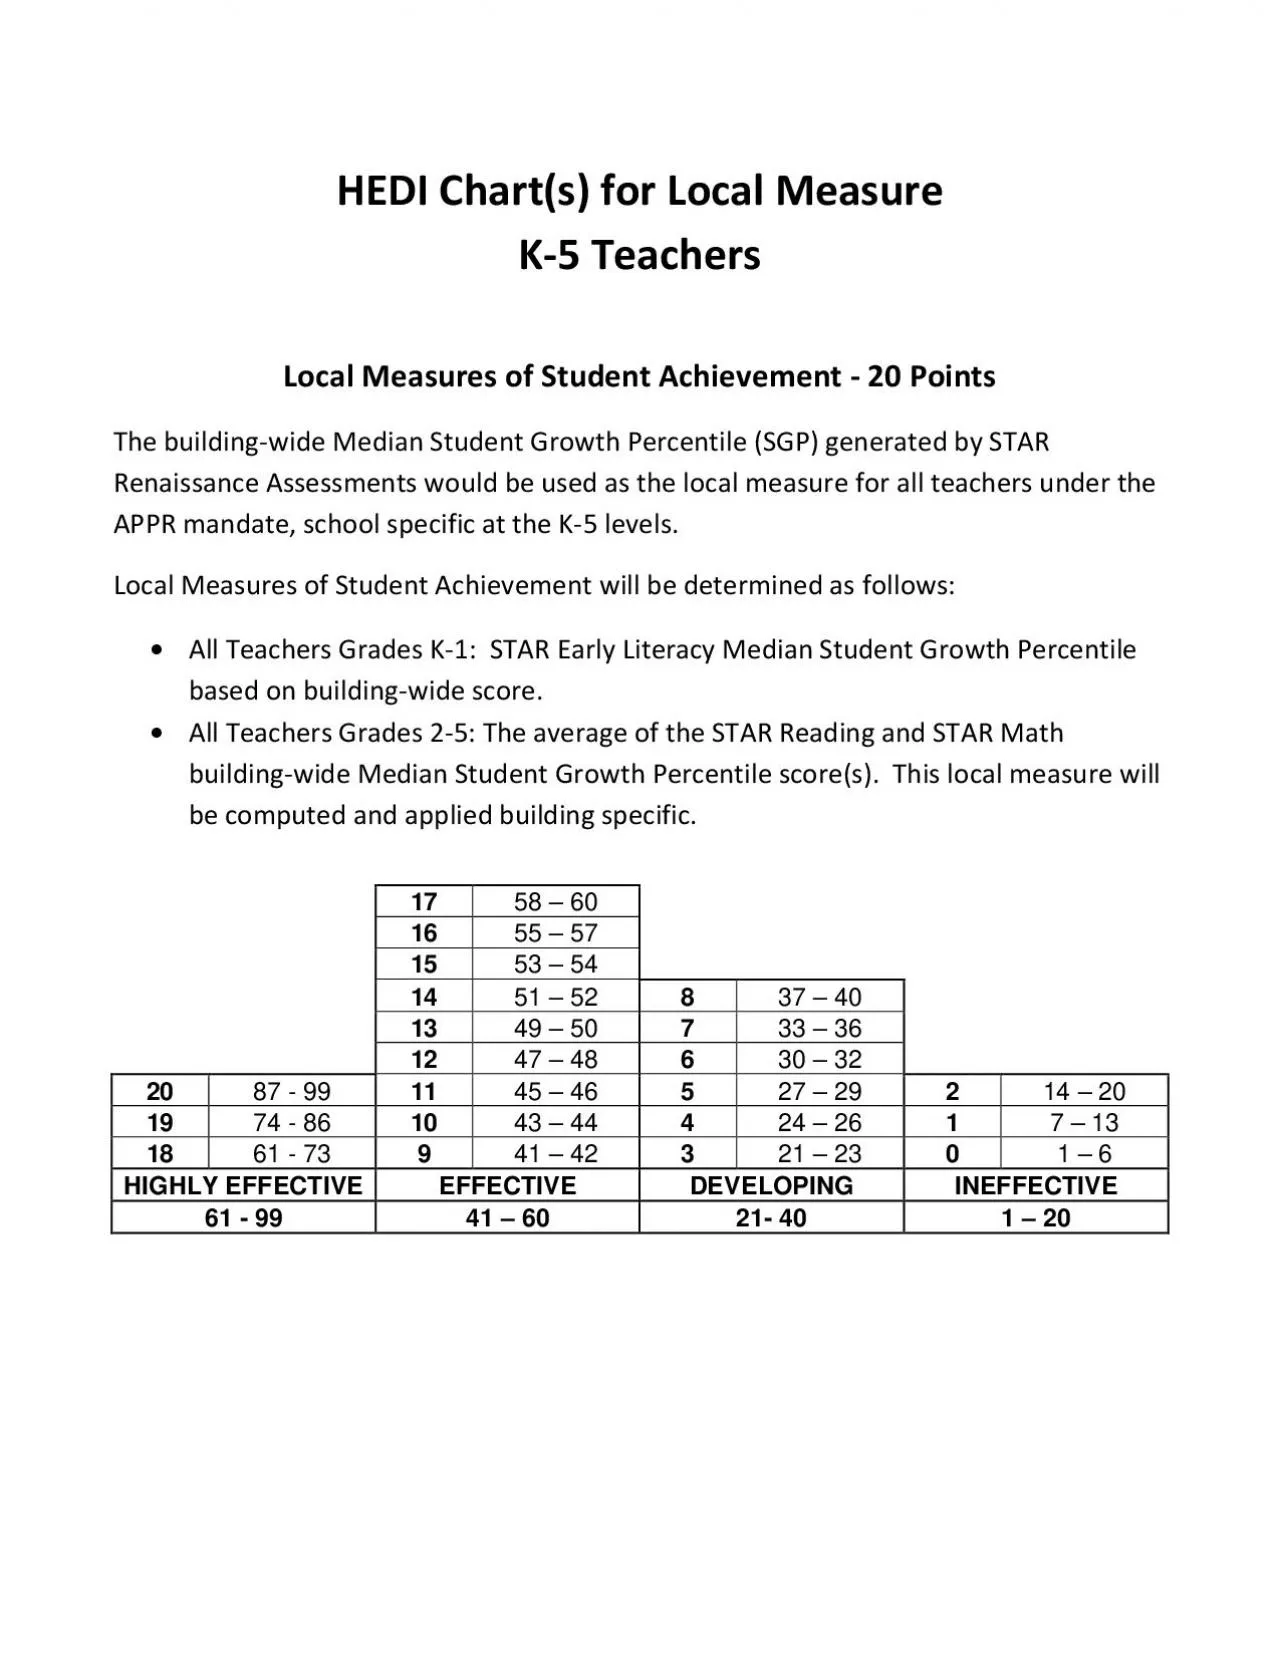
17 58 150 60 16 55 150 57 15 53 54 14 51 150 52 8 37 150 40 13 49 50 7 33 150 36 12 47 150 48 6 30 150 32 20 87 99 11 45 150 46 5 27 150 29 2 14 150 20 19
Presentation Embed Code
Download Presentation
Download Presentation The PPT/PDF document "HEDI Charts for Local Measure5 TeachersL..." is the property of its rightful owner. Permission is granted to download and print the materials on this website for personal, non-commercial use only, and to display it on your personal computer provided you do not modify the materials and that you retain all copyright notices contained in the materials. By downloading content from our website, you accept the terms of this agreement.
HEDI Charts for Local Measure5 TeachersLocal Measures of Student Ach: Transcript
Download Rules Of Document
"HEDI Charts for Local Measure5 TeachersLocal Measures of Student Ach"The content belongs to its owner. You may download and print it for personal use, without modification, and keep all copyright notices. By downloading, you agree to these terms.
Related Documents