/
Hurricane forecasting How to bet on the weather Hurricane forecasting How to bet on the weather

Hurricane forecasting How to bet on the weather - PowerPoint Presentation

audrey
audrey . @audrey
Follow
342 views
Uploaded On 2022-06-07

Hurricane forecasting How to bet on the weather - PPT Presentation

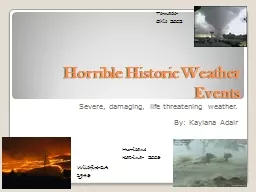
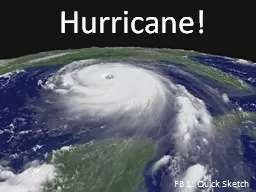
David Simmons Global Head of Research Publications Aon Benfield New York 30 th January 2009 1 Caribbean Catastrophe Risk and Insurance Fund CCRIF 2 Hurricane Dean 3 Example of TSR hurricane Dean forecast ID: 913696

dean hurricane forecasts model hurricane dean model forecasts layer data results peril great hour lead thinkers tsr adjusted models

Share:

Link:

Embed:

Download Presentation from below link

Download Presentation The PPT/PDF document "Hurricane forecasting How to bet on the ..." is the property of its rightful owner. Permission is granted to download and print the materials on this web site for personal, non-commercial use only, and to display it on your personal computer provided you do not modify the materials and that you retain all copyright notices contained in the materials. By downloading content from our website, you accept the terms of this agreement.


Presentation Transcript

Slide1

Hurricane forecastingHow to bet on the weather

David Simmons: Global Head of Research Publications, Aon Benfield

New York – 30

th

January 2009

Slide2

1

Caribbean Catastrophe Risk and Insurance Fund (CCRIF)

Slide3

2

Hurricane Dean

Slide4

3

Example of TSR hurricane Dean forecast

Slide5

4

So what happened?

Slide6

5

TSR wind history showing maximum Dean speeds

Slide7

6

CCRIF after Dean

Slide8

7

Dean and cyclone path forecasting

Slide9

8

Hurricane Wilma – 45 hour lead Cat 1 prediction

Slide10

9

So what interest is this to Insurers?

Slide11

10

Tropical Storm Risk

Slide12

11

Example: Lloyd’s Data Visualisation Service

Example :

Hurricane Dean wind history

Tropical Storm = yellow

Cat 1 Hurricane = green

Slide13

Example: Lloyd’s Data Visualisation Service

12

Slide14

13

Potential use of polygon data

Slide15

14

Adding insurer exposure data to TSR forecasts

95% Hurricane Landfall Probability

9 Hour Lead Time

50% TS Landfall Probability

9 Hour Lead Time

Slide16

15

Automated Hurricane Footprints

Slide17

16

Automated Hurricane Footprints

Slide18

17

But...

Slide19

18

But can use forecasts now

Go to: www.tropicalstormrisk.com

Slide20

19

Using seasonal forecasts with peril models

Slide21

20

Refining peril models

Slide22

21

Using seasonal forecasts with peril models

Slide23

22

Use of DFA model to enhance peril model output

Slide24

23

Adjusted Model Results: Impact of skill levels

Skill

Level

Mean Loss

Low Layer

Pr(Exhaust)

Low Layer

Mean Loss

Top Layer

Pr(Exhaust)

Top Layer

0.1

15%

17%

22%

23%

0.2

31%

33%

49%

51%

0.3

44%

46%

60%

58%

0.4

62%

66%

88%

90%

0.5

75%

78%

98%

99%

0.6

92%

96%

122%

127%

Slide25

24

Adjusted Model Results: Event return periods

Sample Company Blend

Modeled Hurricane Losses

Results are based on RMS and 100,000 ReMetrica

b

simulations

Slide26

25

Adjusted Model Results: XL layers

Slide27

26

And the conclusion is?

Slide28

27

Finally a health warning

Slide29

28

Last word from three great thinkers:

Slide30

29

Last word from three great thinkers:

Slide31

30

Last word from three great thinkers:

Slide32

31

Contact Details