/
An  adjoint-informed  study of tropical An  adjoint-informed  study of tropical

An adjoint-informed study of tropical - PowerPoint Presentation

badra
badra . @badra
Follow
65 views
Uploaded On 2023-09-25

An adjoint-informed study of tropical - PPT Presentation

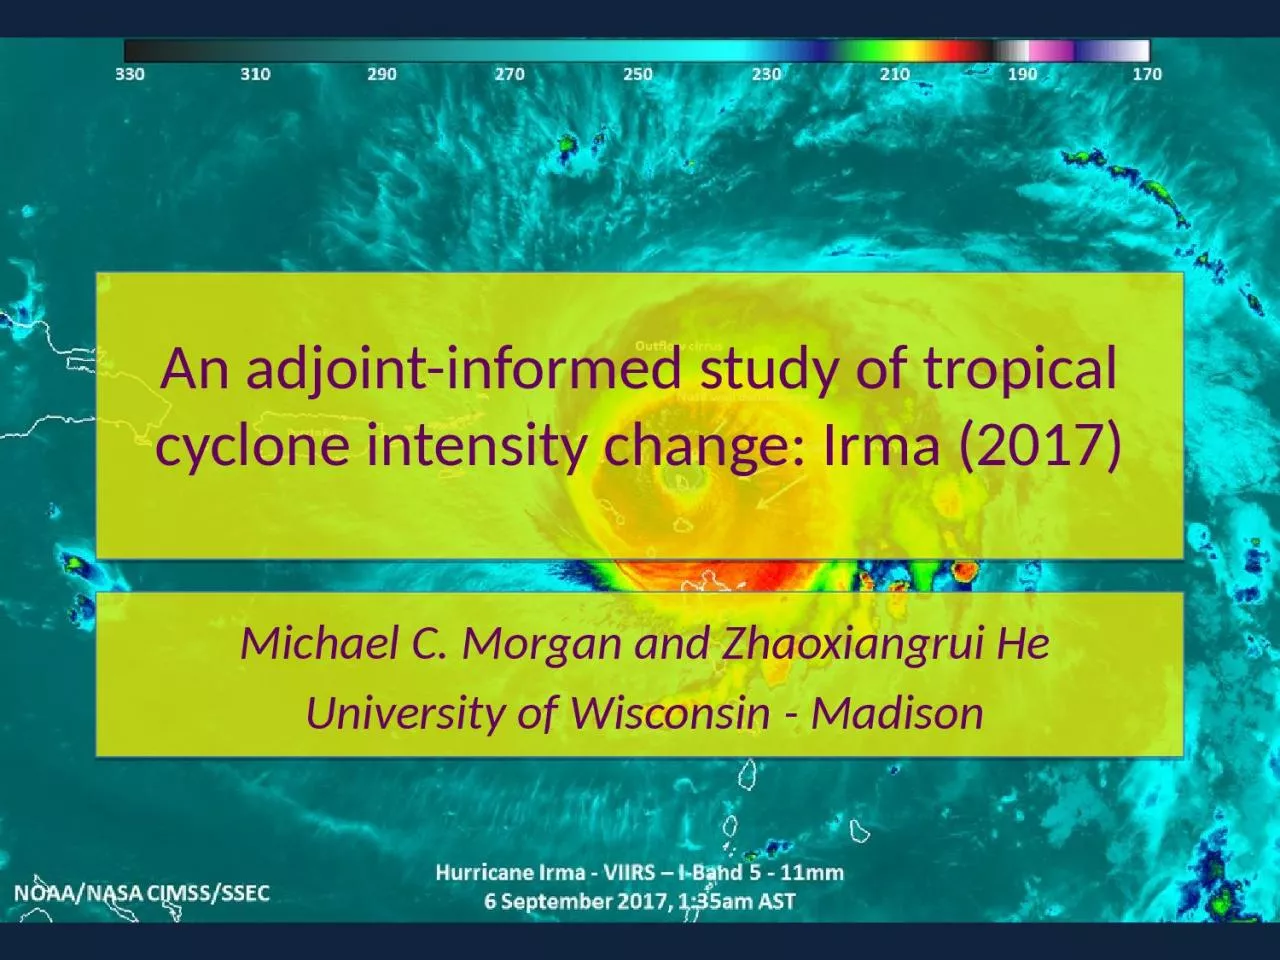
cyclone intensity change Irma 2017 Michael C Morgan and Zhaoxiangrui He University of Wisconsin Madison Motivation Three key questions regarding TC intensity What is the maximum intensity a TC may achieve in a given environment ID: 1021020

parcels air sensitivities intensity air parcels intensity sensitivities environment outflow heat 2010 eyewall adjoint moist surface sensitivity inflow carnot

Share:

Link:

Embed:

Download Presentation from below link

Download Presentation The PPT/PDF document "An adjoint-informed study of tropical" is the property of its rightful owner. Permission is granted to download and print the materials on this web site for personal, non-commercial use only, and to display it on your personal computer provided you do not modify the materials and that you retain all copyright notices contained in the materials. By downloading content from our website, you accept the terms of this agreement.


Presentation Transcript

1. An adjoint-informed study of tropical cyclone intensity change: Irma (2017)Michael C. Morgan and Zhaoxiangrui HeUniversity of Wisconsin - Madison

2. MotivationThree key questions regarding TC intensity:What is the maximum intensity a TC may achieve in a given environment? What factors prevent a TC from reaching its maximum intensity? At what rate will a TC change its intensity in a given environment?

3. MotivationThree key questions regarding TC intensity:What is the maximum intensity a TC may achieve in a given environment? MPIWhat factors prevent a TC from reaching its maximum intensity? Riemer et al. (2010): “that a frustration of the energy cycle yields a decrease in [TC] intensity.”At what rate will a TC change its intensity in a given environment?

4. Carnot view of TC energetics Along the inflow leg, air parcels acquire heat from the ocean surface (B). Riemer et al. (2010)

5. Carnot view of TC energetics Along the inflow leg, air parcels acquire heat from the ocean surface (B). Then, the air parcels rise moist-adiabatically in the eyewall and flare outward at upper-levels (C). Riemer et al. (2010)

6. Carnot view of TC energetics At large radii it is assumed that air parcels lose enough heat through radiative cooling to return to their ambient θe value and that angular momentum is restored (D). Along the inflow leg, air parcels acquire heat from the ocean surface (B). Then, the air parcels rise moist-adiabatically in the eyewall and flare outward at upper-levels (C). Riemer et al. (2010)

7. Carnot view of TC energetics At large radii it is assumed that air parcels lose enough heat through radiative cooling to return to their ambient θe value and that angular momentum is restored (D). Along the inflow leg, air parcels acquire heat from the ocean surface (B). Then, the air parcels rise moist-adiabatically in the eyewall and flare outward at upper-levels (C). The cycle is closed along an absolute vortex line (A) along which the thermodynamic contribution is assumed to be small Riemer et al. (2010)

8. Carnot view of TC energetics At large radii it is assumed that air parcels lose enough heat through radiative cooling to return to their ambient θe value and that angular momentum is restored (D). Along the inflow leg, air parcels acquire heat from the ocean surface (B). Then, the air parcels rise moist-adiabatically in the eyewall and flare outward at upper-levels (C). The cycle is closed along an absolute vortex line (A) along which the thermodynamic contribution is assumed to be small Riemer et al. (2010)

9. Carnot view of TC energetics Possible sinks of energy:mixing of low θe air into eyewall convection or into the inflow layer from convective downdrafts from abovework to expand outflow anticyclone* * not accounted for in MPI theoryRiemer et al. (2010)

10. Tropical atmosphere is characterized by a mid-tropospheric θe minimumEntrainment of this low theta-e air into a TC eyewall can weaken eyewall convection and ultimately the cyclone itselfDowndrafts flush the near-core BL with low θe air thereby quenching the energy source of the storm in the inflow layerRiemer et al. (2010)Thermodynamic “frustration”

11. Dynamical “frustration”The expansion of the outflow layer and formation of the outflow anticyclone is at the expense of the primary cyclonic circulation.This work is dependent on the difference between the angular momentum of the outflow and that of the far environment.This resistance to outflow expansion is related to the inertial stability of the outflow later, the (absolute) vorticity.Any process that can lower the vorticity in the outflow layer, will allow the hurricane to reach a greater intensity.

12.

13.

14. 0000 UTC 5 September

15. 0000 UTC 5 September

16. 1200 UTC 5 September

17. 0000 UTC 6 September

18. WRF V3.8.1 and WRFPLUS V3.8.140 evenly spaced levels30 km grid spacingKessler microphysics, large-scale condensation Initialized with GFS “final analyses” on 0.25° grid24 h forward/adjoint beginning 0000 UTC 5 September 2017

19. 24h response function, R defined as minus the average (dry air) mass = -(psfc - ptop) in a 20 x 20 box centered on the TCResponse function

20. uθ , ur , θe, and RH F12

21. uθ , ur , θe, and RH F12✕DRYΘe minimum

22. uθ, ur , θe, and RH evolution

23. Sensitivity to uθ and urSensitivities to the azimuthal wind are maximized at a radius of 750 km at t = -24h, and gradually contract for shorter adjoint integrations. Increases to primary circulation in annulus about TC increases subsequent intensitySensitivities to radial wind are incoherent until t = 6h

24.

25. Note how the sensitivities appear to spiral anticyclonically inward to the cyclone center

26.

27.

28.

29.

30.

31.

32. Note development of broad negative sensitivities to vorticity – suggestive of weakening inertial stability in outflow layer

33.

34. Evolution of sensitivity to vorticityNote the initially broad distribution of dR/dζ confined mostly to the lower troposphere; the contraction of the maximum sensitivities toward the TC center and the development (though not persistence) of a broad negative sensitivity in the upper-troposphere

35. 850 hPaat t = 0at t = 0

36. Evolution of near surface

37. Sensitivity to qv and TNote:Similarities in distribution of sensitivities away from coreContraction of sensitivities as adjoint integration shortensSensitivity to qv maximum in eye region & above outflow (?!)

38. and basic state Distribution of sensitivities to water vapor mixing ratio suggest moistening the atmosphere in the vicinity of the θe minimum near the TC core results in a stronger TC.

39. and basic state

40. Optimal PerturbationsPerturbations which have minimum energy, e, at the initial time and evolve to change response function by a prescribed amount, dR

41. Evolution of optimal perturbation (KE) Initial perturbation size:

42.

43.

44. Results: Sensitivity to wind/vorticitySensitivities to the horizontal wind field reveal that cyclonic perturbations to the horizontal wind field (nearly centered on the TC location) prior to the response function time, results in a stronger cyclone.Sensitivities to vorticity confirm this interpretation and an “Orr-like” mechanism at workConsistent with inertial stability arguments for both the lower-troposphere and UT/LSSensitivity to radial flow shows no clear signal except for short-length adjoint integration

45. uθNolan and Farrell (1999)Sensitivities are similar to those shown in Nolan and Farrell (1999): structures that spiral back against the flow of the vortex - indicative of how a perturbation must be initially configured so as to maximize the energy it acquires from the meanOrr (1907) originally observed, the growth of a perturbation in linear, inviscid shear flow is determined solely by how far back against the shear the disturbance is originally tilted. ur finite-time optimal

46. Results: Sensitivity to water vaporGenerally positive at all locations, maximizes in the eyewall region for shorter adjoint integrations, more distributed further out in the lower- and mid-troposphere for longer integrationsDistribution at the initial time appears to favor a more moist environment where the analysis is relatively dry.Supports the notion that a more moist environment will support a stronger storm later and consistent with ideas of more moist environment will discourage downdrafts in the spiral band region

47. Results: Sensitivity to temperatureVery similar distribution to sensitivities to water vapor mixing ratioTaken together, suggests increasing the equivalent potential temperature (not necessarily the relative humidity) in the outer band part of the TC at earlier times and the near-TC environment for shorter adjoint integrations.Maximized nearest the surface

48. Minimum central pressure vs. time