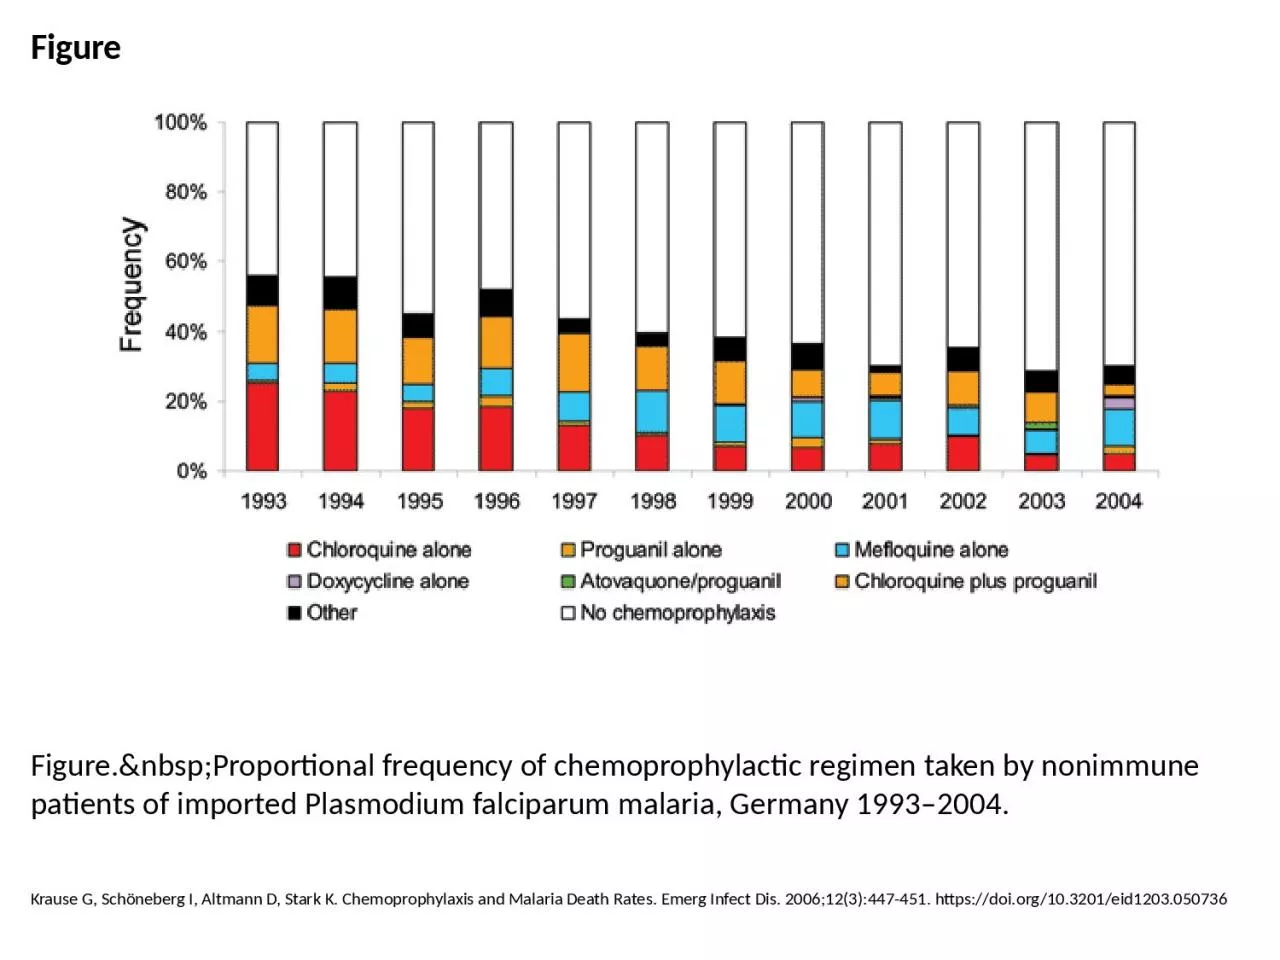
PPT-Figure Figure. Proportional frequency of chemoprophylactic regimen taken by nonimmune
Author : bery | Published Date : 2024-01-29
Krause G Schöneberg I Altmann D Stark K Chemoprophylaxis and Malaria Death Rates Emerg Infect Dis 2006123447451 httpsdoiorg103201eid1203050736
Presentation Embed Code
Download Presentation
Download Presentation The PPT/PDF document "Figure Figure. Proportional fre..." is the property of its rightful owner. Permission is granted to download and print the materials on this website for personal, non-commercial use only, and to display it on your personal computer provided you do not modify the materials and that you retain all copyright notices contained in the materials. By downloading content from our website, you accept the terms of this agreement.
Figure Figure. Proportional frequency of chemoprophylactic regimen taken by nonimmune: Transcript
Download Rules Of Document
"Figure Figure. Proportional frequency of chemoprophylactic regimen taken by nonimmune"The content belongs to its owner. You may download and print it for personal use, without modification, and keep all copyright notices. By downloading, you agree to these terms.
Related Documents