/
A Gendered Approach to Credit Demand: A Gendered Approach to Credit Demand:

A Gendered Approach to Credit Demand: - PowerPoint Presentation

bikershomemaker
bikershomemaker . @bikershomemaker
Follow
344 views
Uploaded On 2020-06-24

A Gendered Approach to Credit Demand: - PPT Presentation

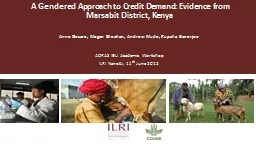
Evidence from Marsabit District Kenya Anne Gesare Megan Sheahan Andrew Mude Rupsha Banerjee ADRAS IBLI Academic Workshop ILRI Nairobi 11 th June 2015 Background Poor households in the ASALs face ID: 786015

demand credit fhh household credit demand household fhh households shocks income risk borrowed ratio aversion amount marsabit borrow gender

Share:

Link:

Embed:

Download Presentation from below link

Download The PPT/PDF document "A Gendered Approach to Credit Demand:" is the property of its rightful owner. Permission is granted to download and print the materials on this web site for personal, non-commercial use only, and to display it on your personal computer provided you do not modify the materials and that you retain all copyright notices contained in the materials. By downloading content from our website, you accept the terms of this agreement.


Presentation Transcript

Slide1

A Gendered Approach to Credit Demand:

Evidence from Marsabit

District, Kenya

Anne Gesare, Megan Sheahan, Andrew Mude, Rupsha Banerjee

ADRAS IBLI Academic WorkshopILRI Nairobi, 11th June 2015

Slide2

BackgroundPoor households in the ASALs face

a multitude of shocks which are both covariant and idiosyncratic in natureThe shocks have a negative impact on the socio and economic welfare of the households which increases their vulnerability to poverty

Women headed households are highly vulnerable to the negative household shocks due to social norms, intra-household inequalities and unsupportive institutions:

ownership and control over resources,

decision making, Low literacy

levels,

Lack of information and poor access to credit

Slide3

BackgroundAccess to a variety of financial instruments can help households manage the multiple shocks they face

SavingsCreditInsurance

Interventions in the area; IBLI, HSNP, saving groups (CARE, BOMA)

Index

insurance; help pastoralists manage the impact of climate related shocks but does not help in household specific losses.

Credit acts as an ex-post response strategy to shocks

Credit services directed towards poor households can help households respond to shocks through

Consumption smoothing

Adoption

of technologies

Productive investment

Slide4

Knowledge gap

Past studiesInterconnection between credit access and household welfare (

Guirkinger and Boucher, 2007)

Coexistence of formal and informal credit markets (

Diagne

,

et.al., 2000, Bell, et al.,

1997)Market imperfections and intra-household dynamics affect rural women’s access and demand for credit (

Quisumbing

2003)

Gaps

Limited knowledge about the functioning of the credit markets in the pastoral context

Factors influencing female HH demand for credit in the pastoral context

Slide5

ObjectivesExplore patterns of credit demand among men and women in Marsabit District

Understand gender differentiated determinants of credit demand in Marsabit DistrictAssessing if shocks influence male and female headed households decision to borrow differently

Research questionsDo shocks affect male and female headed households decision to borrow

differently?

Do risk aversion affects household decision to borrow and how much to borrow?

Slide6

Marsabit District in Eastern

Region16 sub-locations purposively selected924 households panel data

5 years panel data

2.9 attrition rate per year

We use 820 balanced panel households`

Study area and data

Slide7

Empirical Strategy Credit demand; We ask if households borrow credit in the past year, with the expectation of repayment, from whom they borrowed,

amount borrowed and the interest rateCash creditFormal sourcesBanks (Equity, KCB, Cooperative bank)Sacco (

Mwalimu/Mkulima/livestock Traders Sacco)

Informal sourcesFriends/neighbours

FamilyMerry-go-roundsTrader (monetary)Goods on credit

Trader (in kind)

Slide8

Empirical Strategy A double hurdle model is used to assess factors influencing demand and amount borrowed

Model 1

Model 2

= Household

i

for applied for credit in time

t

=

ln

of the amount borrowed

=Gender of household head (FHH=1)


=Risk aversion

= Household shocks

=Household control variables

&

Error terms


Slide9

Household Characteristics (Gender)

 Total (N=820)

Female (

N=308)

Male (N=512)

T-test

Age (Years)

47.9

43.6

50.5

3.58***

Dependency

ratio (Ratio)

0.27

0.27

0.27

0.06

Education

level

(years)

0.98

0.29

1.40

3.26***

Annual

i

ncome (‘000

Kshs

)

44.30

32.7051.272.31**Herd size (TLU)14.11115.001.21**Savings income (‘000

Kshs)7.05

3.819.001.78*Income from livestock (Ratio)0.500.49

0.50

0.50

High risk aversion0.280.250.32.69**Lost animals to drought (%)0.890.910.874.24***Sick HH members (%)0.550.580.53-1.12Financial literacy0.650.670.641.55Number of network groups (count)0.560.380.684.24***HSNP recipient (%)181222-0.89*

Slide10

Characteristics of FHH

Never married

Married

Divorced

Widowed

Proportion (%)

2

50

9

36

Age

(years)

32

42

41

52

Receive HSNP (%0

9

18

0

17

Herd

size (TLU)

4.67

11.8

1.9

7.68

Income

from livestock (ratio)

0.15

0.720.180.47Savings ('000 Kshs)0.000.9610.461.95Total Income ('000 Kshs)12.0541.99

41.72

32.25Livestock losses to drought (%)59804967Borrowed goods on credit (%)37

58

32

45Borrowed formal credit (%)0111Borrowed informal credit (%)615811

Slide11

Credit Applications and Sources (2009-2013)

Gender

Bought goods on credit

Formal credit

Informal credit

All sources

Total number of

HH

2009

M

73

1

21

73

512


F

77

1

28

76

308

2010

M

33

4

13

33

510


F3812838310

2011M

311230516 F

39

0

5393042012M444247506 F5224543142013M482451514 F593362306Pooled

M

46

2

9

47

2558


F

total5048111311504815424100

Slide12

Amount of Credit Borrowed

Slide13

Model 1; Factors influencing demand for Credit

VariableDemand

Variable

Demand

FHH

0.029

Savings

-0.002Animal loss

-0.270**

Income

-0.001**

High risk aversion

0.370

***

Ratio of

income from livestock

-0.03

Ill health

0.225**

Livelihoods

0.090**

Animal loss*FHH

0.396***

Number of children in school

0.026

Ill health*FHH

0.138

Low financial literacy

-0.423*

High risk aversion*FHH

-0.264Range land below normal-0.096TLU-0.011***Age-0.006HSNP0.006**Household size0.06

Fully settled0.065

Dependency ratio-0.429Partially settled-0.001Education-0.005Networks0.077*

Slide14

Model 2: Determinants of Amount Borrowed

VariableCoefficient

Variable

Coefficient

FHH

-0.385

Savings

0.005*

Animal loss

0.124

Income

0.001

Ill health

0.022

Proportion of income from livestock

-0.087

High risk aversion

0.020

Livelihoods

0.038

Animal loss*FHH

0.075

Number of children in school

-0.035

Ill health*FHH

0.299*

Low financial literacy

-

0.150

High risk aversion*FHH

-0.404*Range land below normal-0.210*IBLI purchase

0.020

Age-0.008Fully settled0.514*Household size0.002Partially settled

0.571*

Dependency ratio

0.449TLU0.001Education0.018HSNP recipients0.006Networks-0.007

Slide15

ConclusionHouseholds in Marsabit borrow

for consumption smoothingCredit demand in Marsabit is lower than demand in rural areas of other developing countries

Effects of risk

aversion

on credit demand and amount borrowed differ within MHH and FHH

The relationship between shocks and credit demand differs between MHH and FHH,

HH liquidity reduces demand for

credit but increases amount borrowed

Implications

Conducive

systems in place to

enable

continuous provision of credit especially during shock

aftermaths; tailored to suit pastoralists in terms of accessibility, lending terms and repayment schedules

Encourage

use of mobile based money lending systems;

Mshwari

Slide16

Moving forward

Qualitative study: Understanding the concept of credit demand and the process which goes into the profiling of an individual as credit worthy or not

Understanding the intra-household

gender dynamics around IBLI, who makes the decision to purchase, who

receives the payout, how is the money from payout spent after the payout

Slide17

Thank you!