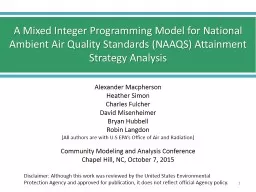
Alexander Macpherson Heather Simon Charles Fulcher David Misenheimer Bryan Hubbell Robin Langdon All authors are with US EPAs Office of Air and Radiation Community Modeling and Analysis Conference ID: 799928
Download The PPT/PDF document "A Mixed Integer Programming Model for Na..." is the property of its rightful owner. Permission is granted to download and print the materials on this web site for personal, non-commercial use only, and to display it on your personal computer provided you do not modify the materials and that you retain all copyright notices contained in the materials. By downloading content from our website, you accept the terms of this agreement.
Slide1
A Mixed Integer Programming Model for National Ambient Air Quality Standards (NAAQS) Attainment Strategy Analysis
Alexander
Macpherson Heather SimonCharles FulcherDavid MisenheimerBryan HubbellRobin Langdon[All authors are with U.S EPA’s Office of Air and Radiation]Community Modeling and Analysis ConferenceChapel Hill, NC, October 7, 2015Disclaimer: Although this work was reviewed by the United States Environmental Protection Agency and approved for publication, it does not reflect official Agency policy.
1
Slide2Overview
2
States with areas designated as nonattainment for the National Ambient Air Quality Standards (NAAQS) are required to develop State Implementation Plans (SIPs)SIPs demonstrate how pollution levels will be reduced to meet the standardWhile historically most states have developed SIPs independently, some states developed regional agreements to control ozone-forming emissionsBecause ozone can be transported regionally, air quality improvement strategies that account for transport may have lower costs
Disclaimer: Although this work was reviewed by the United States Environmental Protection Agency and approved for publication, it does not reflect official Agency policy.
Slide3Overview
3
We present a mathematical programming model that, conditional on the model parameters and input data, can help identify potential minimum-cost emissions control strategies that recognize varying degrees of interstate transport of ozoneA series of national-level model applications are presented drawing on:Future year forecasts of nationwide ozone levelsAir quality source-receptor relationships drawn from a series of air quality model simulations
Technologically and spatially-detailed emissions abatement supplyThe model:
Quickly evaluates alternative attainment scenariosQuickly identifies monitors that are difficult to bring
into attainment
Approximates the nonlinearity of ozone response to NOx
T
ests
the role of transport in compliance
strategies
Disclaimer: Although this work was reviewed by the United States Environmental Protection Agency and approved for publication, it does not reflect official Agency policy.
Slide4The model builds from a tradition of mathematical programming applications in environmental management and planning Kohn modelled least cost air quality management in the St. Louis area (Kohn, 1971)
Atkinson and Lewis compared strategies to reduce emissions at least cost and achieve ambient targets at least cost with strategies where reductions were applied uniformly across point sources until federal standards were met (Atkinson and Lewis, 1974, 1976)Ellis et al. (1985a; 1985b, 1986) applied programming approaches to develop optimal plans for acid rain abatement across eastern parts of North AmericaMore recent applications have focused on ozone planning at city and multi-county scales (Shih et al., 1998; Cohan et al., 2006; Hsu et al., 2014; Liao and Hou, 2015)
4
Literature Review
Disclaimer: Although this work was reviewed by the United States Environmental Protection Agency and approved for publication, it does not reflect official Agency policy.
Slide5Conditional on model parameters and input data, the model minimizes
total cost of:Choices to apply specified emissions controls to sources across regions and states (binary)Choices of level of unspecified controls across regions and states (continuous and non-negative)Subject to:NOx and VOC emissions reductions sufficient to bring monitors into attainment
Emissions reductions cannot exceed specified levelsUser-defined constraints about locations from which emissions reductions may comeAdditional characteristicsIf multiple controls available for a given source, the model makes optimal choice of controlModel tracks reductions of multiple pollutants from a given control application
Our
Model
Disclaimer: Although this work was reviewed by the United States Environmental Protection Agency and approved for publication, it does not reflect official Agency policy.
5
Slide6Identify potential cost-minimizing attainment strategies in achieving national standards of:75 ppb (2008 NAAQS standard)
70 ppb65 ppbFor each alternative standard we vary how the model accounts for interstate ozone transport:State: each state goes it alone (but Northeast states collaborate in each scenario)Regional:
hypothetical transport regions collaborate and account for intra-regional transportNational: hypothetical single nationwide transport region
Scenarios Analyzed
Disclaimer: Although this work was reviewed by the United States Environmental Protection Agency and approved for publication, it does not reflect official Agency policy.
6
Slide7Air Quality Data and Parameters
Disclaimer: Although this work was reviewed by the United States Environmental Protection Agency and approved for publication, it does not reflect official Agency policy.
7
We investigate predicted ozone levels and responses to emissions reductions in the year 2025
We project future ozone levels based on a combination of recently observed ozone and relative changes in modeled ozone between recent and future years
We conduct a series of
emissions sensitivity
air quality model simulations in combination with state-level
source apportionment
modeling to determine
air quality transfer coefficients
for NOx and VOC emissions from regions on following
slides
Air quality transfer coefficients = incremental response in 2025 ozone values per ton of emissions reduction (ppb/ton)
Separate air quality transfer coefficients developed for each pairing of monitor location and NOx or VOC emissions region
Slide8NOx Regions
8
Disclaimer: Although this work was reviewed by the United States Environmental Protection Agency and approved for publication, it does not reflect official Agency policy.
Slide9VOC Regions
9
Disclaimer: Although this work was reviewed by the United States Environmental Protection Agency and approved for publication, it does not reflect official Agency policy.
Slide10Emissions Control Data and Parameters
Disclaimer: Although this work was reviewed by the United States Environmental Protection Agency and approved for publication, it does not reflect official Agency policy.
10
The
emissions control measures and
costs
were primarily drawn from the U.S. EPA’s Control Strategy Tool
(CoST)
Applied
to point, area, and mobile sources of NOx and VOC
emissions
Supplementary data on NOx reductions from coal-fired power plants and diesel engine retrofits and rebuilding were drawn from other EPA
databases
CoST does not does not include measures that reduce NOx through fuel switching, energy efficiency, or other non-traditional control measures
Nationwide, we specified about 73,000
possible
control choices for about 26,000 emissions sources
Cost of unspecified controls were assumed to be $15,000 per ton of NOx or VOC reduction consistent with U.S. EPA’s 2014 Ozone NAAQS Proposal RIA
Slide11Coal
Basecase Conditions
Disclaimer: Although this work was reviewed by the United States Environmental Protection Agency and approved for publication, it does not reflect official Agency policy.
11
Slide12Coal
Results:
Total
Reductions
Disclaimer: Although this work was reviewed by the United States Environmental Protection Agency and approved for publication, it does not reflect official Agency policy.
12
National
Regional
State
Slide13Coal
Results:
NOx
Reductions by Region
Disclaimer: Although this work was reviewed by the United States Environmental Protection Agency and approved for publication, it does not reflect official Agency policy.
13
National
Regional
State
Slide14Coal
Results:
Total Cost
Disclaimer: Although this work was reviewed by the United States Environmental Protection Agency and approved for publication, it does not reflect official Agency policy.
14
National
Regional
State
Slide15Coal
Controlling
Sites
Disclaimer: Although this work was reviewed by the United States Environmental Protection Agency and approved for publication, it does not reflect official Agency policy.
15
The marginal value at the air quality constraint represents the reduction in cost to the system of a 1 ppb increase in the alternative standard applying to the given site
For example, for the 65 ppb alternative standard
National scenario
12 controlling sites ($46 million to $720 million)
Regional scenario
12 controlling sites ($50
million to
$720 million
)
State scenario
15
controlling
sites
($50 million to $720
million)
Slide16Key Caveats
16
Spatial resolution of air quality transfer coefficientsEstimated as an average of region-to-monitor relationships, not emissions source-to-monitor relationships Emissions controlsFuture year emissions in baseline uncertainIncomplete characterization of specified emissions controlsOptimization sensitive to solver parameters and initial valuesDisclaimer: Although this work was reviewed by the United States Environmental Protection Agency and approved for publication, it does not reflect official Agency policy.
Slide17Insights
17
Accounting for ozone transport in developing regional control strategies can result in significantly lower costsSmall number of sites exert leverage on systemDecreases reliance on unspecified reductions and therefore reduces costsVOC controls potentially more important than expectedDisclaimer: Although this work was reviewed by the United States Environmental Protection Agency and approved for publication, it does not reflect official Agency policy.
Slide18Appendix
18
Works CitedAtkinson, S.E., Lewis, D.H., 1974. A cost-effectiveness analysis of alternative air quality control strategies. J. Environ. Econ. Manage. 1, 237-250.Atkinson, S.E., Lewis, D.H., 1976. Determination and implementation of optimal air quality standards. J. Environ. Econ. Manage. 3, 363-380.Cohan, D., Tian, D., Hu, Y., Russell, A., 2006. Control Strategy Optimization for Attainment and Exposure Mitigation: Case Study for Ozone in Macon, Georgia. Environmental Management 38, 451-462.Ellis
, J., McBean, E., Farquhar, G., 1985a. Deterministic Linear Programming Model for Acid Rain Abatement. J. Environ. Eng. 111, 119-139.Ellis, J.H., McBean, E.A., Farquhar, G.J., 1985b. Chance-constrained/stochastic linear programming model for acid rain abatement—I. Complete colinearity and noncolinearity. Atmos. Environ. 19, 925-937.
Ellis, J.H., McBean, E.A., Farquhar, G.J., 1986. Chance-constrained/stochastic linear programming model for acid rain abatement—II. Limited colinearity. Atmos. Environ. 20, 501-511.Hsu, W.-C., Rosenberger, J., Sule, N., Sattler, M., Chen, V.P., 2014. Mixed Integer Linear Programming Models for Selecting Ground-Level Ozone Control Strategies. Environ. Model. Assess. 19, 503-514.
Kohn, R.E., 1971. Application of Linear Programming to a Controversy on Air Pollution Control. Manage. Sci. 17, B-609-B-621
.
Liao K.J, and
X.
Hou X., 2015.
Optimization of Multipollutant Air Quality Management Strategies: a Case Study for Five Cities in the United
States. J.
of Air &
Waste Mgmt. Assoc. 65, 732-742.
Shih
, J.-S., Russell, A.G., McRae, G.J., 1998. An optimization model for photochemical air pollution control. Eur. J. Oper. Res. 106, 1-14
.
Disclaimer: Although this work was reviewed by the United States Environmental Protection Agency and approved for publication, it does not reflect official Agency policy.