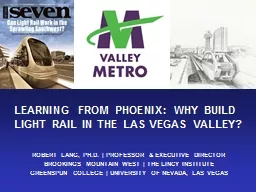
BROOKINGS MOUNTAIN WEST THE LINCY INSTITUTE GREENSPUN COLLEGE UNIVERSITY OF NEVADA LAS VEGAS THE METROPOLITAN REVOLUTION COMES TO GREATER LAS VEGAS Whats in This Talk Define the Metropolitan Revolution and Show How it Applies to Las Vegas ID: 788338
Download The PPT/PDF document "ROBERT LANG, PH.D. | PROFESSOR & EXE..." is the property of its rightful owner. Permission is granted to download and print the materials on this web site for personal, non-commercial use only, and to display it on your personal computer provided you do not modify the materials and that you retain all copyright notices contained in the materials. By downloading content from our website, you accept the terms of this agreement.
Slide1
ROBERT LANG, PH.D. | PROFESSOR & EXECUTIVE DIRECTOR
BROOKINGS MOUNTAIN WEST | THE LINCY INSTITUTE GREENSPUN COLLEGE | UNIVERSITY OF NEVADA, LAS VEGAS
THE METROPOLITAN REVOLUTION COMES TO GREATER LAS VEGAS
Slide2What’s in This Talk?
Define the Metropolitan Revolution and Show How it Applies to Las Vegas?
Cover Next Steps in the Metropolitan Revolution in Higher Ed and Tax Policy
Look at the Metropolitan Revolution Successes so Far in Southern Nevada
All Opinions Expressed in this Talk Are Mine—Don’t Yell at UNLV
Slide3The Metropolitan Revolution Defined
The Metropolitan Revolution is a 2013 Book Published by the Brookings Institution Press by Bruce Katz and Jennifer Bradley
Katz and Bradley Argue that Big Metropolitan Areas are the Key Innovators of the Next American Economy and
T
hey Should Advance Their Own Interests
Slide4Old Versus New Policy Flow Model
Traditional Model
New Metro Model
Policy Used to Flow From the Top Down: From the Federal to Local Government. Under the New Metro Model, Policy Flows from the Bottom Up: From Local to Federal Government.
According to Katz, Locals Need to Directly Petition DC
(ex. Great Society)
(ex. Metro Revolution)
Slide5Metro Networks Drive The Revolution
Metro Networks are Loose, Voluntary Affiliations and are More Flexible than Top-Down Government. Network Includes Leaders in Business, Government, Education, and Non-Profits
Slide6LV
is Not Highlighted in the BookIn 2013, Las Vegas Began its Path Toward the Metro Revolution. By 2016, Southern Nevada Fully Joined this Movement. What Follows are Several Examples of Our Accomplishments to Date.
Slide7The Revolution Begins
Event Was Hosted by Brookings Mountain West and LV Chamber
In 2013, the Southern Nevada Legislative Forum
Met at UNLV
The January 10th
Meeting Predated the Legislative Session
Slide8The Revolution Gains Momentum
Both of These Regional Assets Needed Federal Designation
The LV Chamber Ran a “Chamber on the Hill” DC Event in Fall 2013
The Chamber and its Partners Targeted I-11 and Tule Springs
Slide9The Revolution Gains Momentum
The Region Has a New Environmental Tourist Asset—Also Got I-11
One Result of the DC Trip—Tule Springs National Monument
NLV Mayor Lee Lobbied to Gain Federal Land for His City
Slide10The Revolution Realized: UNLV Med
Southern NV Legislators Made UNLV Med School a Top Priority—We Got it
By 2015, the Southern Nevada Forum
was Ready for a Big Ask
Tripp-Umbach
Showed UNLV Med Adds $1.1B to LV’s GDP Per Year
Slide11The Revolution Realized: Faraday (FF)
NLV Landed FF and a Special Session of NV Legislature OKed
DealNLV Leaders Saw the Tesla Deal and Decided to Emulate it at APEX
The City Adopted New Building Codes and Marketed the Site
Slide12Metropolitan Revolution: Key Lessons
The Region is Proactive and Decides its Own Future—Does Not Wait for DC or State to Act
Initiatives Emerge From Local Leadership Networks Based on a Common Metro Vision
Leadership Networks Organize to Advocate for Major Initiatives and Funding Requests
Local Leaders Work With Federal and State Lawmakers and Agencies on Major Initiatives
Slide13Metropolitan Revolution: Next Steps
The Las Vegas Metropolitan Revolution Needs to Continue and Build on its Success
We Need to Broaden the Network and Activate New Stakeholders to Larger Regional Efforts
The Next Steps Will Emerge Via Leadership Networks, But I Highlight Two Possible Areas: Reforming Higher Ed and Tourist Tax Policy
I Now Turn to Higher Education Reform
Slide14Our Univ. R&D Output Lags Behind
University/Universities
City/
Cities
University R&D($ Millions)Univ. of Arizona
Tucson
$629,466
Colorado State Univ.
Fort Collins$313,238
Oregon State Univ.
Corvallis
$240,507
Mississippi State Univ.
Starkville
$206,424
Kansas State
Univ.
Manhattan
$183,069
Univ. of Alaska
Fairbanks
$162,658
Utah State Univ.
Logan
$158,352
North Dakota State U.
Fargo
$150,173
New Mexico State U.
Las Cruces
$142,365
U. of Central Florida
Orlando
$126,681
UNLV/UNR
Las Vegas/Reno
$125,732
Source: National Science Foundation, R&D Expenditures in 2013
Slide15Land Grants—Southern Mountain West
Land GrantUniversity
Year Land Grant was Founded
State
Population, 2015Colorado State
University
18705,756,574
University of Nevada
1874
2,890,845University of
Arizona
1885
6,828,065
New Mexico State University
1888
2,085,109
Utah State University
1888
2,995,919
Yet, UNR is the Second Oldest Land Grant University in the Region
Slide16Even Mississippi Leads Nevada
Mississippi
Nevada
Population 2015
2,992,3332,890,845
Per Capita Income, 2013
$20,628 (50th)
$26,589 (27th
)Gross Domestic Product (GDP)
$109.1 Billion
$136.9 BillionTotal University
R&D Output, 2013
$402.8 Million
$125.7 Million
With Only 4/5ths NV’s GDP, MS Spends Over 3X on Univ. R&D
Slide17Yet, Nevada Spends Big on Higher Ed
State
$ Per
FTE in 2014State Rank
Arizona
$5,171
36
Colorado$3,022
48
Mississippi
$6,51421
Nevada
$7,016
17
New Jersey
$5,520
31
Oregon
$4,214
46
Utah
$5,506
32
Virginia
$4,779
42
Source: State Higher Education Executive Officers Association
Slide18Before Investing More in Higher Ed
Reform University and College Governance—Real
Community College BoardsForm Senate and Assembly Higher Education/Economic Development Committees
Note—These Changes Cost the State Zero And Higher Ed in Most Places Runs This Way
Slide19Community College-Led Econ. Dev.
Community Colleges Need More Secure Funding and Access to New Revenue
And Need a Volunteer Army of Industry/Civic Leaders on Real CC Governing Boards
CC Workforce Development May Take Priority Over Other Higher Ed Investment
Slide20For Now, the Blanche DuBois Economy
Metropolitan Area
Advanced Industry Jobs
Las Vegas, NV
30,810
Los Angeles, CA
512,890
Phoenix, AZ
152,920
Riverside, CA
63,690
Tucson, AZ
34,130
San Diego, CA
176,280
The Map Shows Robert Lang’s “Megapolitan Geography” of the U.S. Note that Las Vegas Lies in the “Southwest Megapolitan Cluster.” North Las Vegas Applied This Geography to Highlight Workforce Options for FF.
The Table Shows the Southwest’s Advanced Industry Workers. Las
V
egas is in the 2
nd
Biggest Cluster in the U.S.
Slide21Next Up: Tourist Assets and Taxes
The Following Tables Show Tourist Assets in Las Vegas Relative to Other Regions in the U.S.
The Tables Compare Las Vegas on Several Asset Metrics—Including Our Tourist Tax Rates
Our Biggest Threat: Orlando Taxes Tourists the Least and Yet Carves Out a Big Local Revenue Share for Investments in Major Tourist Assets
We Need to Reconsider Our Tax Carve Outs
Slide22Comparing Key Tourist Assets
Metro Area
Domestic Airport Rank
Downtown
Rail to Airport
Conv. Ctr. Rail to Airport
Distance
Conv. Ctr. to Airport
60,000+ Stadium
Atlanta7
YES
YES
12.0
Miles
YES
Chicago
2
YES
YES
18.9
Miles
YES
Dallas
6
YES
YES
25.1 Miles
YES
Denver
8
YES
YES
26.5 Miles
YES
Las Vegas
4
NO
NO
3.6 Miles
NO
Orlando
5
NO
YES
13.0 Miles
YES
Tabulation and Data Analysis by Brookings Mountain West/UNLV
Note: Airport Rank is Based on Origin/Destination & Connections
Slide23Why a Stadium?
As in Orlando, Our Stadium Would Be a Key “Consumption Export”
A Carve Out of the Live Entertainment Tax Should Be Used to Build Entertainment Venues
The Stadium Would Help Diversity the Region’s Core Economy By Adding More Events
If the Stadium Hosts at Least 20 Events, it Will add $800 Million to the Las Vegas Economy
Slide24Comparing Convention Center Space
Metro Area
Main Center
Space Ft
2
Other Centers
Space Ft2
Total Center Space
Ft2
Total Annual Attendance
Total Space Per Attendee
Atlanta
1,500,000
1,000,000
2,500,000
2,287,459
1.09
Chicago
2,670,000
967,000
3,637,000
2,300,000
1.58
Dallas
1,000,000
870,000
1,870,000
1,200,000
1.56
Denver
584,000
133,000
717,000
918,616
0.78
Las Vegas
2,182,167
6,900,000
9,082,167
5,169,054
1.76
Orlando
2,100,000
3,452,000
5,552,000
1,357,387
4.09
Tabulation and Data Analysis by Brookings Mountain West/UNLV
Note: Other Convention Space in Centers with 100,000+ Square Ft
Slide25Comparing Tourist Taxes
Metro
AreaRoom
Tax on $105 Per Day
Car Rental Tax on $57 Per Day
Dining
Tax on a $93 Meal
Total
Tourist Tax BurdenRank
Among Top 50
Atlanta$16.85
$5.71
$7.47
$30.02
23
Chicago
$16.85
$14.16
$10.03
$41.04
1
Dallas
$15.80
$8.56
$7.70
$32.05
15
Denver
$15.53
$9.56
$7.47
$32.56
13
Las Vegas
$12.64
$11.47
$7.56
$31.66
17
Orlando
$13.16
$5.71
$6.07
$25.94
50
Tabulation and Data Analysis by Brookings Mountain West/UNLV
Tourism Tax Data From The Global Business Travel Association
Slide26Summing Up Tourist Assets/Taxes
We Need to: Refurbish/Expand the Convention Center; Build Light Rail; Construct a Stadium
Orlando Built These Assets Despite Having The Lowest Tourist Taxes in the Top 50 U.S. Markets
Las Vegas Needs More Tourist Tax Carve Outs: “It’s Not What You Tax, It’s What You Keep”
Las Vegas Can Show the State That More Tourist Tax Carve Outs Will Add More General Revenue
Slide27Final Thoughts on the Revolution
Las Vegas is Home to Nearly 3/4
th of the State’s People and Outputs a Larger Share of GDP
Given it’s Size, Southern Nevada Can Simply Tell the State What it Needs and Get it
But That is True Only if We Speak in One Loud, Clear Voice as We Did on the UNLV Med School
Every
Future Legislative Session Needs a UNLV Med School-Size
Deliverable—Let’s Pick One
Slide28Thank
You