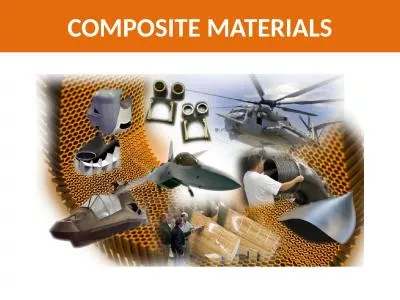
PDF-16TH INTERNATIONAL CONFERENCE ON COMPOSITE MATERIALS 1
Author : briana-ranney | Published Date : 2016-09-19
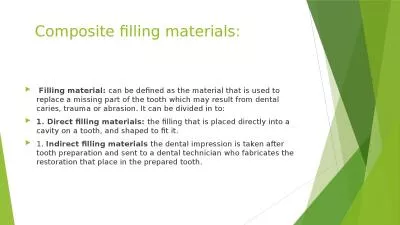
Abstract This paper presents the analysis of a honeycomb core sandwich composite subject to a low velocity impact resulting in barely visible impact damage BVID
Presentation Embed Code
Download Presentation
Download Presentation The PPT/PDF document "16TH INTERNATIONAL CONFERENCE ON COMPOSI..." is the property of its rightful owner. Permission is granted to download and print the materials on this website for personal, non-commercial use only, and to display it on your personal computer provided you do not modify the materials and that you retain all copyright notices contained in the materials. By downloading content from our website, you accept the terms of this agreement.
16TH INTERNATIONAL CONFERENCE ON COMPOSITE MATERIALS 1: Transcript
Download Rules Of Document
"16TH INTERNATIONAL CONFERENCE ON COMPOSITE MATERIALS 1"The content belongs to its owner. You may download and print it for personal use, without modification, and keep all copyright notices. By downloading, you agree to these terms.
Related Documents