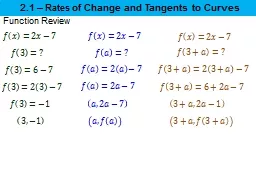
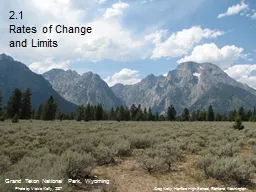
Greg Kelly Hanford High School Richland Washington Photo by Vickie Kelly 2007 Grand Teton National Park Wyoming Suppose you drive 200 miles and it takes you 4 hours Then your average speed is ID: 465662
Download Presentation The PPT/PDF document "2.1 Rates of Change and Limits" is the property of its rightful owner. Permission is granted to download and print the materials on this web site for personal, non-commercial use only, and to display it on your personal computer provided you do not modify the materials and that you retain all copyright notices contained in the materials. By downloading content from our website, you accept the terms of this agreement.
Slide1
2.1Rates of Change and Limits
Greg Kelly, Hanford High School, Richland, Washington
Photo by Vickie Kelly, 2007
Grand Teton National Park, WyomingSlide2
Suppose you drive 200 miles, and it takes you 4 hours.
Then your average speed is:
If you look at your speedometer during this trip, it might read 65 mph. This is your
instantaneous speed
.Slide3
A rock falls from a high cliff.
The position of the rock is given by:
After 2 seconds:
average
speed:
What is the
instantaneous
speed at 2 seconds?Slide4
for some very small change in
t
where
h
= some very small change in
t
We can use the TI-89 to evaluate this expression for smaller and smaller values of
h
.Slide5
1
80
0.1
65.6
.01
64.16
.001
64.016
.0001
64.0016
.00001
64.0002
We can see that the velocity approaches 64 ft/sec as
h
becomes very small.
We say that the velocity has a
limiting value
of 64 as
h
approaches zero
.
(Note that
h
never actually becomes zero.)Slide6
The limit as
h
approaches zero:
0
Since the 16 is unchanged as
h
approaches zero, we can factor 16 out.Slide7
Consider:
What happens as
x
approaches zero?
Graphically:
WINDOW
Y=
GRAPHSlide8
Looks like y=1Slide9
Numerically:
TblSet
You can scroll down to see more values.
TABLESlide10
You can scroll down to see more values.
TABLE
It appears that the limit of as
x
approaches zero is 1Slide11
Limit notation:
“The limit of
f
of
x
as
x
approaches
c
is
L
.”
So:Slide12
The
limit
of a function refers to the value that the function
approaches
,
not
the actual value (if any).
not 1Slide13
Properties of Limits:
Limits can be added, subtracted, multiplied, multiplied by a constant, divided, and raised to a power.
(See your book for details.)
For a limit to exist, the function must approach the
same value
from both sides.
One-sided limits
approach from either the left or right side only.Slide14
1
2
3
4
1
2
At x=1:
left hand limit
right hand limit
value of the function
does not exist because the left and right hand limits do not match!Slide15
At x=2:
left hand limit
right hand limit
value of the function
because the left and right hand limits match.
1
2
3
4
1
2Slide16
At x=3:
left hand limit
right hand limit
value of the function
because the left and right hand limits match.
1
2
3
4
1
2Slide17
The Sandwich Theorem:
Show that:
The maximum value of sine is 1, so
The minimum value of sine is -1, so
So:Slide18
By the sandwich theorem:
Y=
WINDOWSlide19
p