/
Complexes of Small Chiral Molecules: Complexes of Small Chiral Molecules:

Complexes of Small Chiral Molecules: - PowerPoint Presentation

briana-ranney
briana-ranney . @briana-ranney
Follow
376 views
Uploaded On 2018-02-18

Complexes of Small Chiral Molecules: - PPT Presentation

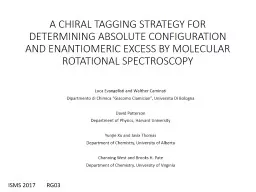
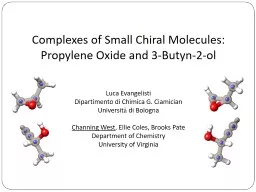
Propylene Oxide and 3Butyn2ol Luca Evangelisti Dipartimento di Chimica G Ciamician Universit à di Bologna Channing West Ellie Coles Brooks Pate Department of Chemistry University of Virginia ID: 632949

butynol tag signal chiral tag butynol chiral signal analyte oxide rotational propylene excess high homochiral intensity heterochiral calibration enantiomeric

Share:

Link:

Embed:

Download Presentation from below link

Download Presentation The PPT/PDF document "Complexes of Small Chiral Molecules:" is the property of its rightful owner. Permission is granted to download and print the materials on this web site for personal, non-commercial use only, and to display it on your personal computer provided you do not modify the materials and that you retain all copyright notices contained in the materials. By downloading content from our website, you accept the terms of this agreement.


Presentation Transcript

Slide1

Complexes of Small Chiral Molecules:Propylene Oxide and 3-Butyn-2-ol

Luca EvangelistiDipartimento di Chimica G. CiamicianUniversità di BolognaChanning West, Ellie Coles, Brooks PateDepartment of ChemistryUniversity of VirginiaSlide2

For “N” chiral centers

2N stereoisomers2(N-1) unique geometries2 enantiomers per diastereomer

Need for

universally applicable enantiomeric excess

methods

Quantitative ratios of

all stereoisomersComplex mixture analysisRapid monitoringEnantiomers – mirror images but not superimposableDiastereomers – molecules with multiple chiral centers that are not mirror images (distinct geometries)

Chiral Analysis

Image Credit: http://doktori.bme.hu/bme_palyazat/2013/honlap/Bagi_Peter_en.htm

Carlos

Kleber

Z. Andrade*,

Otilie

E.

Vercillo

, Juliana P. Rodrigues and Denise P.

Silveira

,

J. Braz. Chem. Soc

.,

15

,

813-817, 2004. Slide3

The sign of the product of dipole vector components are opposite for enantiomers

Three Wave Mixing: Enantiomer AnalysisD. Patterson, M. Schnell, and J.M Doyle, Nature 497, 475- 478 (2013).D. Patterson and J.M. Doyle, Phys. Rev. Lett. 111, 023008 (2013).J.U. Grabow

, Angew

. Chem. 52, 11698 (2013).

V.A Shubert, D. Schmitz, D. Patterson, J.M Doyle, and M. Schnell,

Angew

. Chem. 52, (2013).

m

b

Simon Lobsiger, Cristobal Perez, Luca Evangelisti, Kevin K. Lehmann, Brooks H. Pate, “Molecular Structure and Chirality Detection by Fourier Transform Microwave Spectroscopy”, J. Phys. Chem. Lett. 6, 196-200 (2015).

m

a

m

b

m

c

(-)

m

a

m

b

mc

(+)Slide4

Challenges of Three Wave Mixing: Enantiomeric Excess

Enantiomeric Excess (EE):Needs a reference sample with known EE due to single detection window for enantiomersPotential for errors in high EE limitAbsolute Configuration (AC):

Phase dependence

Small dipole component can produce erroneous resultsSlide5

S-3MCH

Enantiomers Diastereomers

Rotational Spectroscopy: Chiral Tagging

S-

Butynol

S-3MCH

R-ButynolBy complexing with a separate chiral moleculeAdvantagesEnantiomers now have distinct spectra“Tag” can provide dipole moment

Reference-free EE determinationHigh enantiopurity limitSlide6

Rotational Spectroscopy for Chiral Analysis: Diastereomers

Chirped-Pulse FTMW SpectroscopyLow Frequency (2-8 GHz):Peak Transition Intensity of Large MoleculesHigh Resolution + Broadband Coverage: Mixture AnalysisExtreme sensitivity to mass distributionAgreement with Theory: “Library-Free” Diastereomer Identification

C. Perez, S.

Lobsiger

, N. A. Seifert, D. P.

Zaleski

, B.

Temelso

, G.C. Shields, Z.

Kisiel, B. H. Pate, Chem. Phys. Lett.

571, 1 (2013).Slide7

Enantiopure Chiral Tag ((S)-(-)-3-butyn-2-ol)

Heterochiral Spectrum (+/-)Homochiral Spectrum

(-/-)

Enantiomer populations converted to different

diastereomers with distinct spectra

Analogy to Chromatography

Different enantiomers gives signals in distinct detection windowsBackground free detection permits determination of high EE when peaks are highly resolved

Rotational spectroscopy can be used to identify which enantiomer gives each signal

Rotational spectroscopy has the potential for significant decreases in analysis time

(Chiral GC Example:

30 min

)

(1S)-(-)-verbenone

+

(S)-(-)-3-butyn-2-ol

(1R)-(+)-verbenone

+

(S)-(-)-3-butyn-2-ol

Ideal Case: Enantiopure Chiral TagSlide8

Calibration and Analysis for Enantiomer Excess Determination

53.6% EESlide9

Actual Measurement Conditions: Effects Due to the Enantiomeric Excess of the Chiral Tag

Chiral Tag Has High Enantiopurity: Alfa Aesar Sample(S)-(-)-butynol: 99.3%(R)-(+)-butynol: 0.7%EE: 98.6%

Homochiral Species:

Tag(-) + Analyte(-): (1-

) (1-f

+

)Tag(+) + Analyte(+):  f

+

Heterochiral Species:

Tag(-) + Analyte(+): (1-

) f

+

Tag(+) + Analyte(-):

(1- f

+

)

Sample mole fractions:

Chiral Tag: (-): 1-

 Analyte: (-): (1-f

+

)

(+):  (<<1) (+): f+

ee

= (1-2)

ee

= (1-2f

+

)

Note:

EE =

ee

x 100

Linear Assumption: Number Density of Complex Proportional to the

Product of Number Densities for the EnantiomersSlide10

Linear Assumption: Signal Level for an Individual Rotational Transition

SignalHOMO = CHOMO * ( [Tag(-)][Analyte(-)] + [Tag(+)][Analyte(+)] )SignalHETERO

= C

HETERO

* ( [Tag(-)][Analyte(+)] + [Tag(+)][Analyte(-)] )

Signal Normalization:

For a racemic tag sample ( = 0.5):

Signal

HOMO = C

HOMO * 0.5

Signal

HETERO

= CHETERO

* 0.5

N =

(SignalHOMO

/Signal

HETERO )

The ratio of the transition intensities using racemic

tag

Effect: For any PAIR of heterochiral

and homochiral

transitions in the spectrum

Normalization

Transitions have unequal intensity due to intrinsic transition strength, isomer populations, and instrument intensity calibration

Enantiomeric Excess MeasurementsSlide11

Linear Assumption: Signal Level for an Individual Rotational Transition

SignalHOMO = CHOMO * ( [Tag(-)][Analyte(-)] + [Tag(+)][Analyte(+)] )SignalHETERO

= C

HETERO

* ( [Tag(-)][Analyte(+)] + [Tag(+)][Analyte(-)] )

EE Determination:

Using the high enantiopurity tag ( << 1):

Signal

HOMO = C

HOMO * [(1-

) (1-f+

) + 

f

+]

Signal

HETERO

= C

HETERO * [(1-

) f

+ +  (1- f

+) ]

Calculate the Normalized Signal Ratio (R):

R = N * (SignalHETERO/

Signal

HOMO

)

Effect: For any PAIR of

heterochiral

and

homochiral

transitions in the spectrum

Normalized Signal

With Racemic Tag

Intensity Changes with use of High Enantiopurity Tag

Normalized Signal

Ratio (R)

Result:

Enantiomeric Excess MeasurementsSlide12

Butynol:

AUTOTAG (Walther Caminati)Measure the spectrum of racemic butynol and high enantiopurity butynol and use the rotational transitions of the homochiral and heterochiral dimer spectra

EE calibration does not require assignment of the dimer spectra

(for the high enantiopurity sample, homochiral complexes approximately double in intensity and heterochiral complexes nearly disappear when compared to the intensities in the racemic spectrum)

Calibration of

Butynol and Propylene Oxide Chiral TagsSample Composition:(S)-butynol: 99.05(15)%(R)-butynol: 0.95(15)%Certificate of Analysis:(S)-butynol: 99.3%

(R)-butynol: 0.7%Slide13

Calibration of

Butynol and Propylene Oxide Chiral TagsPropylene Oxide: Calibration with ButynolThe lowest energy isomer of the propylene oxide dimer has a small dipole moment limiting the measurement sensitivity.The transition intensities for the propylene oxide – butynol complex are a factor of 10 higher than the strongest transitions observed for the propylene oxide dimer (RR2).The homochiral and heterochiral complexes of propylene oxide – butynol have been assigned and verified by Kraitchman substitution structures and can be used for chiral tagging

Homochiral

HeterochiralSlide14

Butynol Dimer Present in this Measurement: Can Calibrate both Butynol and Propylene Oxide

Calibration of Butynol and Propylene Oxide Chiral TagsSlide15

Using Auto Tag Calibration of Butynol:

EE = 98.1(3)The verbenone EE determinations are:Four Nozzle: EE = 53.0(5.9)Single Nozzle: EE = 52.7(4.8)Certificate of Analysis: EE = 53.6%Enantiomeric Excess of Verbenone RevisitedSlide16

Acknowledgements

This work supported by the National Science Foundation (CHE 1531913) and The Virginia Biosciences Health Research CorporationSpecial thanks for work on chiral tag rotational spectroscopy:Luca EvangelistiDave Patterson, Yunjie Xu, Walther Caminati, Javix Thomas, David Pratt, Smitty Grubbs, Galen SedoMark Marshall, Helen Leung, Kevin Lehmann, Justin NeillFrank Marshall, Marty Holdren, Kevin Mayer, Taylor Smart, Reilly Sonstrom, Ellie Coles, Elizabeth Franck, John Gordon, Julia Kuno, Pierce

Eggan, Victoria Kim, Ethan Wood, Megan Yu

Slide17

Conclusion

Rotational spectroscopy has the potential to be a powerful analytical tool for determining enantiomeric excess in the high EE limitCorrection for tag enantiopurity is necessary for accurate analytical work Results are reproducible and narrowly distributed in the high EE limitSlide18

Effect of Intensity Fluctuations Between Racemic and Enantiopure MeasurementsModeling of EE Determination using 5% intensity fluctuation on transitions

Distribution width is linear in (100-EE) – amount of enantio impurityDistribution width is linear in the intensity fluctuation